
 Yahoo Finance
 Some Investors May Be Worried About LyondellBasell Industries' (NYSE:LYB) Returns On Capital
If we want to find a potential multi-bagger, often there are underlying trends that can provide clues. In a perfect world, we'd like to see a company investing more capital into its business and ideally the returns earned from that capital are also increasing. Basically this means that a company has profitable initiatives that it can continue to reinvest in, which is a trait of a compounding machine. Having said that, from a first glance at LyondellBasell Industries (NYSE:LYB) we aren't jumping out of our chairs at how returns are trending, but let's have a deeper look.
Understanding Return On Capital Employed (ROCE)
If you haven't worked with ROCE before, it measures the 'return' (pre-tax profit) a company generates from capital employed in its business. The formula for this calculation on LyondellBasell Industries is:
Return on Capital Employed = Earnings Before Interest and Tax (EBIT) ÷ (Total Assets - Current Liabilities)
0.15 = US$4.4b ÷ (US$36b - US$6.5b) (Based on the trailing twelve months to March 2023).
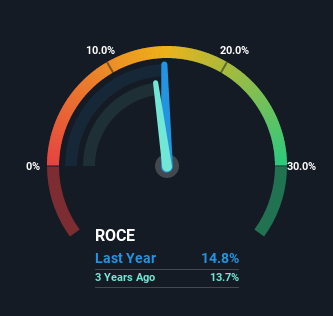
Thus, LyondellBasell Industries has an ROCE of 15%. In absolute terms, that's a satisfactory return, but compared to the Chemicals industry average of 11% it's much better.
See our latest analysis for LyondellBasell Industries
In the above chart we have measured LyondellBasell Industries' prior ROCE against its prior performance, but the future is arguably more important. If you'd like, you can check out the forecasts from the analysts covering LyondellBasell Industries here for free.
What The Trend Of ROCE Can Tell Us
In terms of LyondellBasell Industries' historical ROCE movements, the trend isn't fantastic. Around five years ago the returns on capital were 26%, but since then they've fallen to 15%. Meanwhile, the business is utilizing more capital but this hasn't moved the needle much in terms of sales in the past 12 months, so this could reflect longer term investments. It's worth keeping an eye on the company's earnings from here on to see if these investments do end up contributing to the bottom line.
The Bottom Line
Bringing it all together, while we're somewhat encouraged by LyondellBasell Industries' reinvestment in its own business, we're aware that returns are shrinking. Unsurprisingly, the stock has only gained 9.2% over the last five years, which potentially indicates that investors are accounting for this going forward. As a result, if you're hunting for a multi-bagger, we think you'd have more luck elsewhere.
LyondellBasell Industries does have some risks though, and we've spotted 4 warning signs for LyondellBasell Industries that you might be interested in.
If you want to search for solid companies with great earnings, check out this free list of companies with good balance sheets and impressive returns on equity.
Have feedback on this article? Concerned about the content? Get in touch with us directly. Alternatively, email editorial-team (at) simplywallst.com.
This article by Simply Wall St is general in nature. We provide commentary based on historical data and analyst forecasts only using an unbiased methodology and our articles are not intended to be financial advice. It does not constitute a recommendation to buy or sell any stock, and does not take account of your objectives, or your financial situation. We aim to bring you long-term focused analysis driven by fundamental data. Note that our analysis may not factor in the latest price-sensitive company announcements or qualitative material. Simply Wall St has no position in any stocks mentioned.
Join A Paid User Research Session
You’ll receive a US$30 Amazon Gift card for 1 hour of your time while helping us build better investing tools for the individual investors like yourself. Sign up here
