
 Yahoo Finance
 Some Investors May Be Worried About Joules Group's (LON:JOUL) Returns On Capital
What are the early trends we should look for to identify a stock that could multiply in value over the long term? Typically, we'll want to notice a trend of growing return on capital employed (ROCE) and alongside that, an expanding base of capital employed. Basically this means that a company has profitable initiatives that it can continue to reinvest in, which is a trait of a compounding machine. Having said that, from a first glance at Joules Group (LON:JOUL) we aren't jumping out of our chairs at how returns are trending, but let's have a deeper look.
What is Return On Capital Employed (ROCE)?
If you haven't worked with ROCE before, it measures the 'return' (pre-tax profit) a company generates from capital employed in its business. To calculate this metric for Joules Group, this is the formula:
Return on Capital Employed = Earnings Before Interest and Tax (EBIT) ÷ (Total Assets - Current Liabilities)
0.022 = UK£2.0m ÷ (UK£193m - UK£103m) (Based on the trailing twelve months to November 2021).
So, Joules Group has an ROCE of 2.2%. In absolute terms, that's a low return and it also under-performs the Luxury industry average of 19%.
See our latest analysis for Joules Group
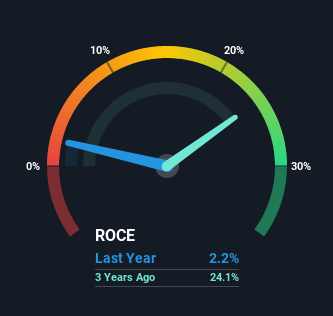
Above you can see how the current ROCE for Joules Group compares to its prior returns on capital, but there's only so much you can tell from the past. If you're interested, you can view the analysts predictions in our free report on analyst forecasts for the company.
What Can We Tell From Joules Group's ROCE Trend?
When we looked at the ROCE trend at Joules Group, we didn't gain much confidence. To be more specific, ROCE has fallen from 26% over the last five years. However, given capital employed and revenue have both increased it appears that the business is currently pursuing growth, at the consequence of short term returns. If these investments prove successful, this can bode very well for long term stock performance.
Another thing to note, Joules Group has a high ratio of current liabilities to total assets of 54%. This can bring about some risks because the company is basically operating with a rather large reliance on its suppliers or other sorts of short-term creditors. Ideally we'd like to see this reduce as that would mean fewer obligations bearing risks.
In Conclusion...
While returns have fallen for Joules Group in recent times, we're encouraged to see that sales are growing and that the business is reinvesting in its operations. These growth trends haven't led to growth returns though, since the stock has fallen 69% over the last five years. So we think it'd be worthwhile to look further into this stock given the trends look encouraging.
If you'd like to know more about Joules Group, we've spotted 3 warning signs, and 1 of them is a bit concerning.
For those who like to invest in solid companies, check out this free list of companies with solid balance sheets and high returns on equity.
Have feedback on this article? Concerned about the content? Get in touch with us directly. Alternatively, email editorial-team (at) simplywallst.com.
This article by Simply Wall St is general in nature. We provide commentary based on historical data and analyst forecasts only using an unbiased methodology and our articles are not intended to be financial advice. It does not constitute a recommendation to buy or sell any stock, and does not take account of your objectives, or your financial situation. We aim to bring you long-term focused analysis driven by fundamental data. Note that our analysis may not factor in the latest price-sensitive company announcements or qualitative material. Simply Wall St has no position in any stocks mentioned.