
 Yahoo Finance
 Some Investors May Be Worried About Celebrus Technologies' (LON:CLBS) Returns On Capital
To find a multi-bagger stock, what are the underlying trends we should look for in a business? Amongst other things, we'll want to see two things; firstly, a growing return on capital employed (ROCE) and secondly, an expansion in the company's amount of capital employed. This shows us that it's a compounding machine, able to continually reinvest its earnings back into the business and generate higher returns. Having said that, from a first glance at Celebrus Technologies (LON:CLBS) we aren't jumping out of our chairs at how returns are trending, but let's have a deeper look.
Understanding Return On Capital Employed (ROCE)
For those that aren't sure what ROCE is, it measures the amount of pre-tax profits a company can generate from the capital employed in its business. The formula for this calculation on Celebrus Technologies is:
Return on Capital Employed = Earnings Before Interest and Tax (EBIT) ÷ (Total Assets - Current Liabilities)
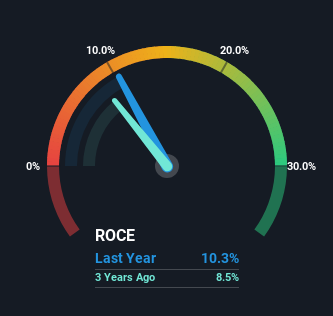
0.10 = UK£3.2m ÷ (UK£47m - UK£16m) (Based on the trailing twelve months to September 2023).
Therefore, Celebrus Technologies has an ROCE of 10%. That's a relatively normal return on capital, and it's around the 12% generated by the IT industry.
View our latest analysis for Celebrus Technologies
In the above chart we have measured Celebrus Technologies' prior ROCE against its prior performance, but the future is arguably more important. If you're interested, you can view the analysts predictions in our free analyst report for Celebrus Technologies .
The Trend Of ROCE
In terms of Celebrus Technologies' historical ROCE movements, the trend isn't fantastic. To be more specific, ROCE has fallen from 34% over the last five years. Meanwhile, the business is utilizing more capital but this hasn't moved the needle much in terms of sales in the past 12 months, so this could reflect longer term investments. It may take some time before the company starts to see any change in earnings from these investments.
On a side note, Celebrus Technologies' current liabilities have increased over the last five years to 34% of total assets, effectively distorting the ROCE to some degree. Without this increase, it's likely that ROCE would be even lower than 10%. Keep an eye on this ratio, because the business could encounter some new risks if this metric gets too high.
In Conclusion...
To conclude, we've found that Celebrus Technologies is reinvesting in the business, but returns have been falling. Additionally, the stock's total return to shareholders over the last five years has been flat, which isn't too surprising. All in all, the inherent trends aren't typical of multi-baggers, so if that's what you're after, we think you might have more luck elsewhere.
On a final note, we've found 1 warning sign for Celebrus Technologies that we think you should be aware of.
For those who like to invest in solid companies, check out this free list of companies with solid balance sheets and high returns on equity.
Have feedback on this article? Concerned about the content? Get in touch with us directly. Alternatively, email editorial-team (at) simplywallst.com.
This article by Simply Wall St is general in nature. We provide commentary based on historical data and analyst forecasts only using an unbiased methodology and our articles are not intended to be financial advice. It does not constitute a recommendation to buy or sell any stock, and does not take account of your objectives, or your financial situation. We aim to bring you long-term focused analysis driven by fundamental data. Note that our analysis may not factor in the latest price-sensitive company announcements or qualitative material. Simply Wall St has no position in any stocks mentioned.
