
 Yahoo Finance
 Investors in LKQ (NASDAQ:LKQ) have made a respectable return of 82% over the past three years
By buying an index fund, investors can approximate the average market return. But many of us dare to dream of bigger returns, and build a portfolio ourselves. For example, LKQ Corporation (NASDAQ:LKQ) shareholders have seen the share price rise 79% over three years, well in excess of the market return (20%, not including dividends).
Now it's worth having a look at the company's fundamentals too, because that will help us determine if the long term shareholder return has matched the performance of the underlying business.
Check out our latest analysis for LKQ
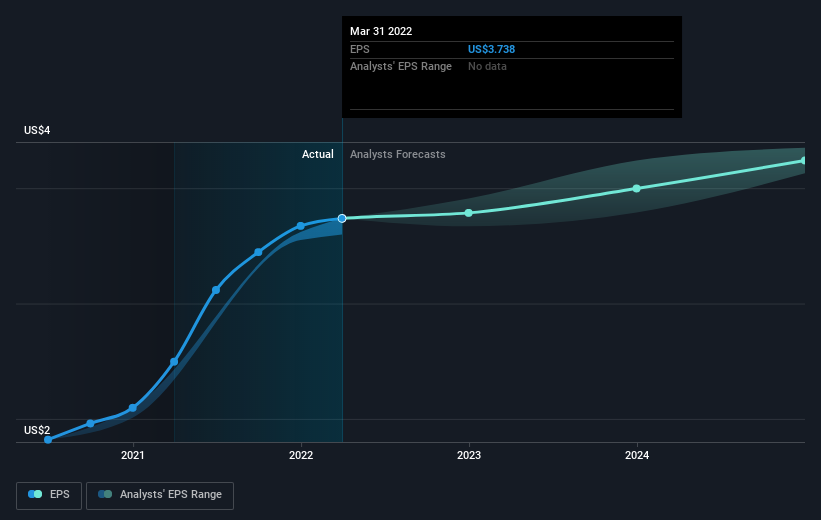
There is no denying that markets are sometimes efficient, but prices do not always reflect underlying business performance. One flawed but reasonable way to assess how sentiment around a company has changed is to compare the earnings per share (EPS) with the share price.
During three years of share price growth, LKQ achieved compound earnings per share growth of 42% per year. The average annual share price increase of 21% is actually lower than the EPS growth. So it seems investors have become more cautious about the company, over time.
The graphic below depicts how EPS has changed over time (unveil the exact values by clicking on the image).
It is of course excellent to see how LKQ has grown profits over the years, but the future is more important for shareholders. This free interactive report on LKQ's balance sheet strength is a great place to start, if you want to investigate the stock further.
What About Dividends?
When looking at investment returns, it is important to consider the difference between total shareholder return (TSR) and share price return. The TSR is a return calculation that accounts for the value of cash dividends (assuming that any dividend received was reinvested) and the calculated value of any discounted capital raisings and spin-offs. So for companies that pay a generous dividend, the TSR is often a lot higher than the share price return. In the case of LKQ, it has a TSR of 82% for the last 3 years. That exceeds its share price return that we previously mentioned. And there's no prize for guessing that the dividend payments largely explain the divergence!
A Different Perspective
Although it hurts that LKQ returned a loss of 1.0% in the last twelve months, the broader market was actually worse, returning a loss of 21%. Longer term investors wouldn't be so upset, since they would have made 8%, each year, over five years. In the best case scenario the last year is just a temporary blip on the journey to a brighter future. I find it very interesting to look at share price over the long term as a proxy for business performance. But to truly gain insight, we need to consider other information, too. For instance, we've identified 2 warning signs for LKQ that you should be aware of.
For those who like to find winning investments this free list of growing companies with recent insider purchasing, could be just the ticket.
Please note, the market returns quoted in this article reflect the market weighted average returns of stocks that currently trade on US exchanges.
Have feedback on this article? Concerned about the content? Get in touch with us directly. Alternatively, email editorial-team (at) simplywallst.com.
This article by Simply Wall St is general in nature. We provide commentary based on historical data and analyst forecasts only using an unbiased methodology and our articles are not intended to be financial advice. It does not constitute a recommendation to buy or sell any stock, and does not take account of your objectives, or your financial situation. We aim to bring you long-term focused analysis driven by fundamental data. Note that our analysis may not factor in the latest price-sensitive company announcements or qualitative material. Simply Wall St has no position in any stocks mentioned.
