
 Yahoo Finance
 Investors in Live Ventures (NASDAQ:LIVE) have made a solid return of 287% over the past three years
The last three months have been tough on Live Ventures Incorporated (NASDAQ:LIVE) shareholders, who have seen the share price decline a rather worrying 32%. But that doesn't change the fact that the returns over the last three years have been very strong. In three years the stock price has launched 287% higher: a great result. After a run like that some may not be surprised to see prices moderate. If the business can perform well for years to come, then the recent drop could be an opportunity.
With that in mind, it's worth seeing if the company's underlying fundamentals have been the driver of long term performance, or if there are some discrepancies.
See our latest analysis for Live Ventures
While markets are a powerful pricing mechanism, share prices reflect investor sentiment, not just underlying business performance. One way to examine how market sentiment has changed over time is to look at the interaction between a company's share price and its earnings per share (EPS).
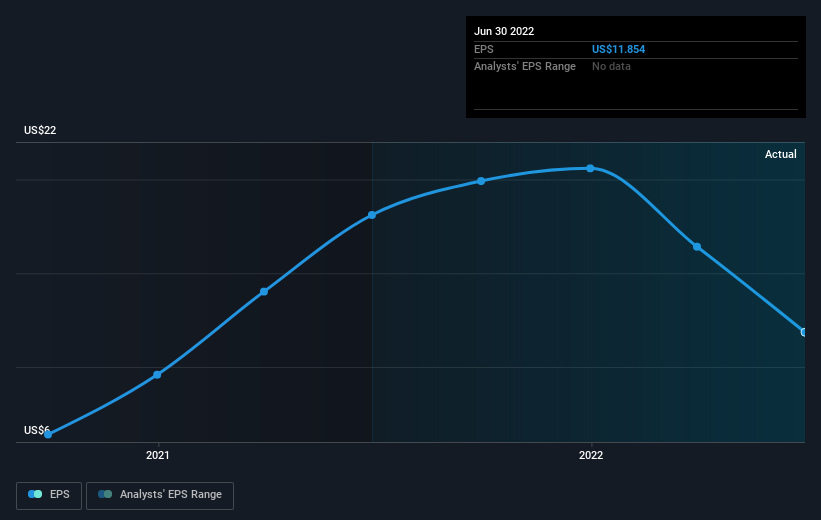
During three years of share price growth, Live Ventures achieved compound earnings per share growth of 79% per year. The average annual share price increase of 57% is actually lower than the EPS growth. Therefore, it seems the market has moderated its expectations for growth, somewhat. We'd venture the lowish P/E ratio of 2.49 also reflects the negative sentiment around the stock.
You can see below how EPS has changed over time (discover the exact values by clicking on the image).
We like that insiders have been buying shares in the last twelve months. Having said that, most people consider earnings and revenue growth trends to be a more meaningful guide to the business. Dive deeper into the earnings by checking this interactive graph of Live Ventures' earnings, revenue and cash flow.
A Different Perspective
We regret to report that Live Ventures shareholders are down 41% for the year. Unfortunately, that's worse than the broader market decline of 16%. However, it could simply be that the share price has been impacted by broader market jitters. It might be worth keeping an eye on the fundamentals, in case there's a good opportunity. On the bright side, long term shareholders have made money, with a gain of 20% per year over half a decade. It could be that the recent sell-off is an opportunity, so it may be worth checking the fundamental data for signs of a long term growth trend. I find it very interesting to look at share price over the long term as a proxy for business performance. But to truly gain insight, we need to consider other information, too. To that end, you should learn about the 4 warning signs we've spotted with Live Ventures (including 3 which make us uncomfortable) .
Live Ventures is not the only stock insiders are buying. So take a peek at this free list of growing companies with insider buying.
Please note, the market returns quoted in this article reflect the market weighted average returns of stocks that currently trade on US exchanges.
Have feedback on this article? Concerned about the content? Get in touch with us directly. Alternatively, email editorial-team (at) simplywallst.com.
This article by Simply Wall St is general in nature. We provide commentary based on historical data and analyst forecasts only using an unbiased methodology and our articles are not intended to be financial advice. It does not constitute a recommendation to buy or sell any stock, and does not take account of your objectives, or your financial situation. We aim to bring you long-term focused analysis driven by fundamental data. Note that our analysis may not factor in the latest price-sensitive company announcements or qualitative material. Simply Wall St has no position in any stocks mentioned.
Join A Paid User Research Session
You’ll receive a US$30 Amazon Gift card for 1 hour of your time while helping us build better investing tools for the individual investors like yourself. Sign up here