
 Yahoo Finance
 What Investors Should Know About CSL Limited’s (ASX:CSL) Financial Strength

Want to help shape the future of investing tools? Participate in a short research study and receive a 6-month subscription to the award winning Simply Wall St research tool (valued at $60)!
There are a number of reasons that attract investors towards large-cap companies such as CSL Limited (ASX:CSL), with a market cap of AU$88b. Risk-averse investors who are attracted to diversified streams of revenue and strong capital returns tend to seek out these large companies. But, the key to their continued success lies in its financial health. Today we will look at CSL’s financial liquidity and debt levels, which are strong indicators for whether the company can weather economic downturns or fund strategic acquisitions for future growth. Remember this is a very top-level look that focuses exclusively on financial health, so I recommend a deeper analysis into CSL here.
See our latest analysis for CSL
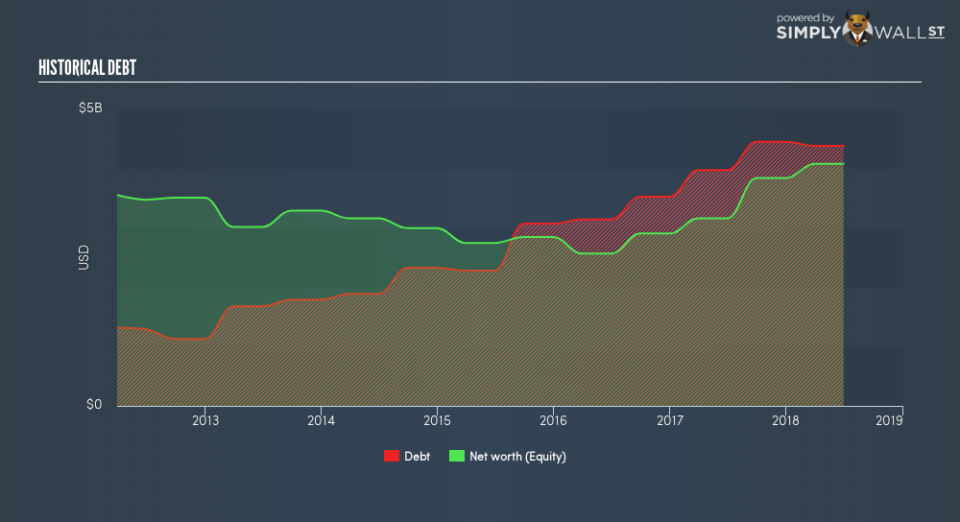
How does CSL’s operating cash flow stack up against its debt?
CSL has built up its total debt levels in the last twelve months, from US$4.0b to US$4.4b – this includes long-term debt. With this increase in debt, CSL’s cash and short-term investments stands at US$816m for investing into the business. Moreover, CSL has generated US$1.9b in operating cash flow over the same time period, leading to an operating cash to total debt ratio of 43%, signalling that CSL’s operating cash is sufficient to cover its debt. This ratio can also be interpreted as a measure of efficiency as an alternative to return on assets. In CSL’s case, it is able to generate 0.43x cash from its debt capital.
Can CSL meet its short-term obligations with the cash in hand?
Looking at CSL’s US$1.9b in current liabilities, it appears that the company has been able to meet these obligations given the level of current assets of US$5.0b, with a current ratio of 2.61x. Generally, for Biotechs companies, this is a reasonable ratio since there’s a sufficient cash cushion without leaving too much capital idle or in low-earning investments.
Does CSL face the risk of succumbing to its debt-load?
CSL is a highly levered company given that total debt exceeds equity. This is common amongst large-cap companies because debt can often be a less expensive alternative to equity due to tax deductibility of interest payments. Accordingly, large companies often have an advantage over small-caps through lower cost of capital due to cheaper financing. We can assess the sustainability of CSL’s debt levels to the test by looking at how well interest payments are covered by earnings. A company generating earnings after interest and tax at least three times its net interest payments is considered financially sound. In CSL’s case, the ratio of 24.02x suggests that interest is amply covered. High interest coverage is seen as a responsible and safe practice, which highlights why most investors believe large-caps such as CSL is a safe investment.
Next Steps:
Although CSL’s debt level is towards the higher end of the spectrum, its cash flow coverage seems adequate to meet obligations which means its debt is being efficiently utilised. This may mean this is an optimal capital structure for the business, given that it is also meeting its short-term commitment. Keep in mind I haven’t considered other factors such as how CSL has been performing in the past. I suggest you continue to research CSL to get a better picture of the large-cap by looking at:
Future Outlook: What are well-informed industry analysts predicting for CSL’s future growth? Take a look at our free research report of analyst consensus for CSL’s outlook.
Valuation: What is CSL worth today? Is the stock undervalued, even when its growth outlook is factored into its intrinsic value? The intrinsic value infographic in our free research report helps visualize whether CSL is currently mispriced by the market.
Other High-Performing Stocks: Are there other stocks that provide better prospects with proven track records? Explore our free list of these great stocks here.
To help readers see past the short term volatility of the financial market, we aim to bring you a long-term focused research analysis purely driven by fundamental data. Note that our analysis does not factor in the latest price-sensitive company announcements.
The author is an independent contributor and at the time of publication had no position in the stocks mentioned. For errors that warrant correction please contact the editor at editorial-team@simplywallst.com.
