
 Yahoo Finance
 What Investors Should Know About Capstone Mining Corp’s (TSE:CS) Financial Strength

Capstone Mining Corp (TSE:CS) is a small-cap stock with a market capitalization of CA$446.77m. While investors primarily focus on the growth potential and competitive landscape of the small-cap companies, they end up ignoring a key aspect, which could be the biggest threat to its existence: its financial health. Why is it important? So, understanding the company’s financial health becomes essential, since poor capital management may bring about bankruptcies, which occur at a higher rate for small-caps. I believe these basic checks tell most of the story you need to know. Nevertheless, I know these factors are very high-level, so I recommend you dig deeper yourself into CS here.
How does CS’s operating cash flow stack up against its debt?
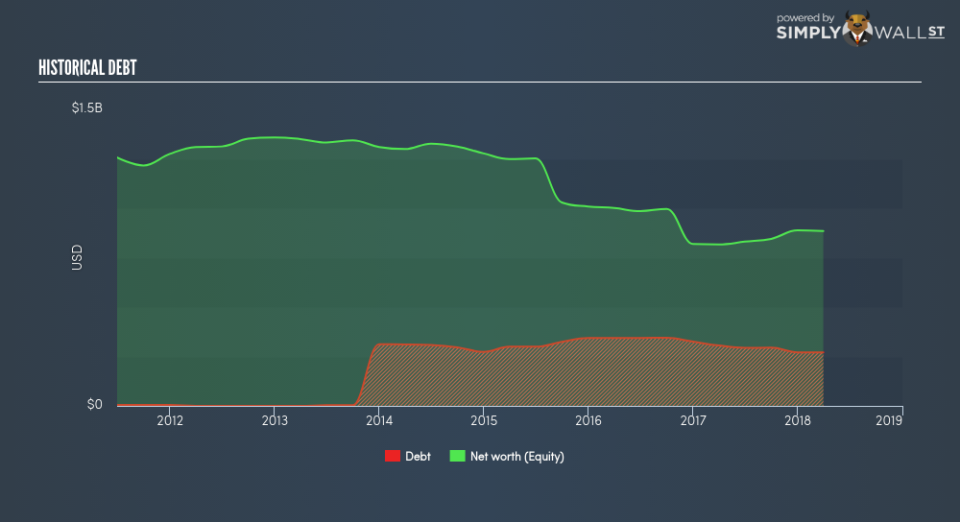
Over the past year, CS has reduced its debt from CA$324.98m to CA$270.71m – this includes both the current and long-term debt. With this debt payback, CS’s cash and short-term investments stands at CA$116.20m , ready to deploy into the business. Moreover, CS has produced cash from operations of CA$112.51m during the same period of time, leading to an operating cash to total debt ratio of 41.56%, meaning that CS’s debt is appropriately covered by operating cash. This ratio can also be a sign of operational efficiency as an alternative to return on assets. In CS’s case, it is able to generate 0.42x cash from its debt capital.
Can CS meet its short-term obligations with the cash in hand?
With current liabilities at CA$59.81m, it appears that the company has maintained a safe level of current assets to meet its obligations, with the current ratio last standing at 4.17x. However, a ratio greater than 3x may be considered as too high, as CS could be holding too much capital in a low-return investment environment.
Does CS face the risk of succumbing to its debt-load?
CS’s level of debt is appropriate relative to its total equity, at 30.62%. This range is considered safe as CS is not taking on too much debt obligation, which may be constraining for future growth. We can test if CS’s debt levels are sustainable by measuring interest payments against earnings of a company. Ideally, earnings before interest and tax (EBIT) should cover net interest by at least three times. For CS, the ratio of 5.51x suggests that interest is appropriately covered, which means that lenders may be less hesitant to lend out more funding as CS’s high interest coverage is seen as responsible and safe practice.
Next Steps:
CS’s high cash coverage and appropriate debt levels indicate its ability to utilise its borrowings efficiently in order to generate ample cash flow. In addition to this, the company exhibits proper management of current assets and upcoming liabilities. Keep in mind I haven’t considered other factors such as how CS has been performing in the past. You should continue to research Capstone Mining to get a better picture of the stock by looking at:
Future Outlook: What are well-informed industry analysts predicting for CS’s future growth? Take a look at our free research report of analyst consensus for CS’s outlook.
Valuation: What is CS worth today? Is the stock undervalued, even when its growth outlook is factored into its intrinsic value? The intrinsic value infographic in our free research report helps visualize whether CS is currently mispriced by the market.
Other High-Performing Stocks: Are there other stocks that provide better prospects with proven track records? Explore our free list of these great stocks here.
To help readers see pass the short term volatility of the financial market, we aim to bring you a long-term focused research analysis purely driven by fundamental data. Note that our analysis does not factor in the latest price sensitive company announcements.
The author is an independent contributor and at the time of publication had no position in the stocks mentioned.
