
 Yahoo Finance
 Investors Interested In Seatrium Limited's (SGX:S51) Revenues
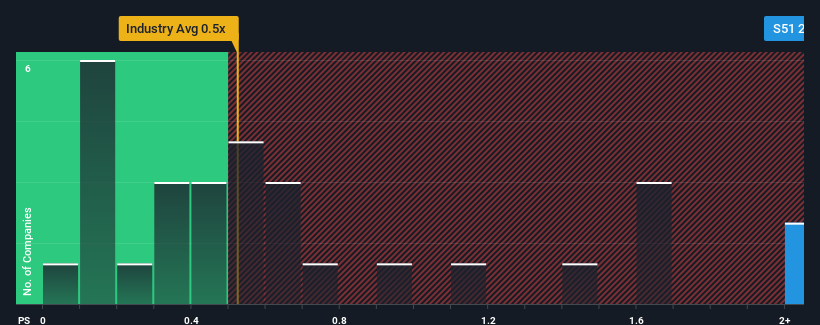
When you see that almost half of the companies in the Machinery industry in Singapore have price-to-sales ratios (or "P/S") below 0.5x, Seatrium Limited (SGX:S51) looks to be giving off some sell signals with its 2.4x P/S ratio. However, the P/S might be high for a reason and it requires further investigation to determine if it's justified.
See our latest analysis for Seatrium
What Does Seatrium's Recent Performance Look Like?
Seatrium certainly has been doing a good job lately as it's been growing revenue more than most other companies. The P/S is probably high because investors think this strong revenue performance will continue. If not, then existing shareholders might be a little nervous about the viability of the share price.
Keen to find out how analysts think Seatrium's future stacks up against the industry? In that case, our free report is a great place to start.
Do Revenue Forecasts Match The High P/S Ratio?
The only time you'd be truly comfortable seeing a P/S as high as Seatrium's is when the company's growth is on track to outshine the industry.
If we review the last year of revenue growth, the company posted a terrific increase of 77%. The strong recent performance means it was also able to grow revenue by 66% in total over the last three years. So we can start by confirming that the company has done a great job of growing revenue over that time.
Looking ahead now, revenue is anticipated to climb by 32% per year during the coming three years according to the seven analysts following the company. With the industry only predicted to deliver 8.4% each year, the company is positioned for a stronger revenue result.
With this in mind, it's not hard to understand why Seatrium's P/S is high relative to its industry peers. Apparently shareholders aren't keen to offload something that is potentially eyeing a more prosperous future.
The Final Word
Typically, we'd caution against reading too much into price-to-sales ratios when settling on investment decisions, though it can reveal plenty about what other market participants think about the company.
We've established that Seatrium maintains its high P/S on the strength of its forecasted revenue growth being higher than the the rest of the Machinery industry, as expected. At this stage investors feel the potential for a deterioration in revenues is quite remote, justifying the elevated P/S ratio. It's hard to see the share price falling strongly in the near future under these circumstances.
Plus, you should also learn about this 1 warning sign we've spotted with Seatrium.
Of course, profitable companies with a history of great earnings growth are generally safer bets. So you may wish to see this free collection of other companies that have reasonable P/E ratios and have grown earnings strongly.
Have feedback on this article? Concerned about the content? Get in touch with us directly. Alternatively, email editorial-team (at) simplywallst.com.
This article by Simply Wall St is general in nature. We provide commentary based on historical data and analyst forecasts only using an unbiased methodology and our articles are not intended to be financial advice. It does not constitute a recommendation to buy or sell any stock, and does not take account of your objectives, or your financial situation. We aim to bring you long-term focused analysis driven by fundamental data. Note that our analysis may not factor in the latest price-sensitive company announcements or qualitative material. Simply Wall St has no position in any stocks mentioned.