
 Yahoo Finance
 Investors ignore increasing losses at Axsome Therapeutics (NASDAQ:AXSM) as stock jumps 7.0% this past week
When you buy shares in a company, it's worth keeping in mind the possibility that it could fail, and you could lose your money. But on the bright side, you can make far more than 100% on a really good stock. One great example is Axsome Therapeutics, Inc. (NASDAQ:AXSM) which saw its share price drive 217% higher over five years. Better yet, the share price has risen 7.0% in the last week.
The past week has proven to be lucrative for Axsome Therapeutics investors, so let's see if fundamentals drove the company's five-year performance.
See our latest analysis for Axsome Therapeutics
Because Axsome Therapeutics made a loss in the last twelve months, we think the market is probably more focussed on revenue and revenue growth, at least for now. When a company doesn't make profits, we'd generally hope to see good revenue growth. Some companies are willing to postpone profitability to grow revenue faster, but in that case one would hope for good top-line growth to make up for the lack of earnings.
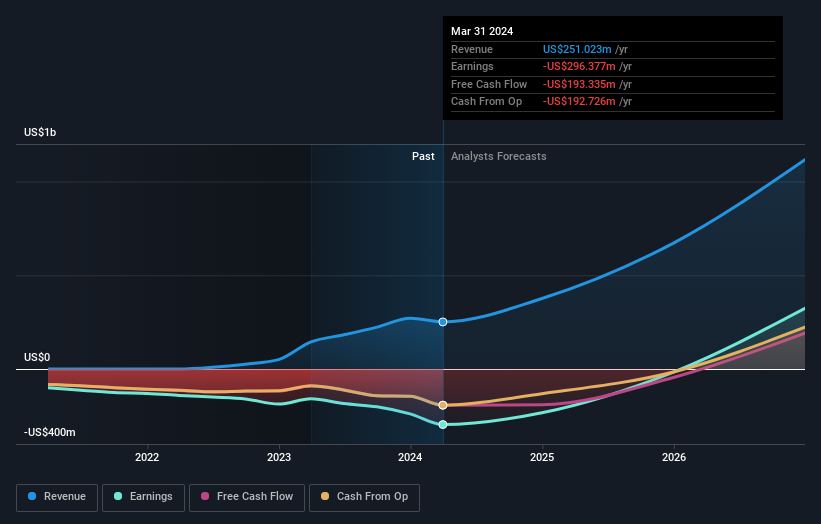
In the last 5 years Axsome Therapeutics saw its revenue grow at 87% per year. Even measured against other revenue-focussed companies, that's a good result. So it's not entirely surprising that the share price reflected this performance by increasing at a rate of 26% per year, in that time. So it seems likely that buyers have paid attention to the strong revenue growth. Axsome Therapeutics seems like a high growth stock - so growth investors might want to add it to their watchlist.
The graphic below depicts how earnings and revenue have changed over time (unveil the exact values by clicking on the image).
Axsome Therapeutics is a well known stock, with plenty of analyst coverage, suggesting some visibility into future growth. You can see what analysts are predicting for Axsome Therapeutics in this interactive graph of future profit estimates.
A Different Perspective
Axsome Therapeutics shareholders are down 12% for the year, but the market itself is up 24%. Even the share prices of good stocks drop sometimes, but we want to see improvements in the fundamental metrics of a business, before getting too interested. Longer term investors wouldn't be so upset, since they would have made 26%, each year, over five years. It could be that the recent sell-off is an opportunity, so it may be worth checking the fundamental data for signs of a long term growth trend. It's always interesting to track share price performance over the longer term. But to understand Axsome Therapeutics better, we need to consider many other factors. For instance, we've identified 1 warning sign for Axsome Therapeutics that you should be aware of.
For those who like to find winning investments this free list of undervalued companies with recent insider purchasing, could be just the ticket.
Please note, the market returns quoted in this article reflect the market weighted average returns of stocks that currently trade on American exchanges.
Have feedback on this article? Concerned about the content? Get in touch with us directly. Alternatively, email editorial-team (at) simplywallst.com.
This article by Simply Wall St is general in nature. We provide commentary based on historical data and analyst forecasts only using an unbiased methodology and our articles are not intended to be financial advice. It does not constitute a recommendation to buy or sell any stock, and does not take account of your objectives, or your financial situation. We aim to bring you long-term focused analysis driven by fundamental data. Note that our analysis may not factor in the latest price-sensitive company announcements or qualitative material. Simply Wall St has no position in any stocks mentioned.
Have feedback on this article? Concerned about the content? Get in touch with us directly. Alternatively, email editorial-team@simplywallst.com
