
 Yahoo Finance
 Investors Holding Back On Perpetual Energy Inc. (TSE:PMT)
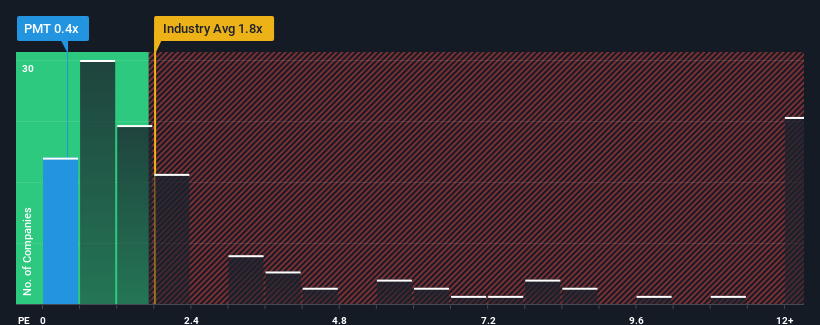
With a price-to-sales (or "P/S") ratio of 0.4x Perpetual Energy Inc. (TSE:PMT) may be sending bullish signals at the moment, given that almost half of all the Oil and Gas companies in Canada have P/S ratios greater than 1.8x and even P/S higher than 7x are not unusual. Although, it's not wise to just take the P/S at face value as there may be an explanation why it's limited.
View our latest analysis for Perpetual Energy
What Does Perpetual Energy's P/S Mean For Shareholders?
Perpetual Energy has been doing a good job lately as it's been growing revenue at a solid pace. One possibility is that the P/S is low because investors think this respectable revenue growth might actually underperform the broader industry in the near future. If you like the company, you'd be hoping this isn't the case so that you could potentially pick up some stock while it's out of favour.
Although there are no analyst estimates available for Perpetual Energy, take a look at this free data-rich visualisation to see how the company stacks up on earnings, revenue and cash flow.
Do Revenue Forecasts Match The Low P/S Ratio?
In order to justify its P/S ratio, Perpetual Energy would need to produce sluggish growth that's trailing the industry.
Retrospectively, the last year delivered an exceptional 29% gain to the company's top line. Pleasingly, revenue has also lifted 54% in aggregate from three years ago, thanks to the last 12 months of growth. Therefore, it's fair to say the revenue growth recently has been superb for the company.
Weighing the recent medium-term upward revenue trajectory against the broader industry's one-year forecast for contraction of 6.6% shows it's a great look while it lasts.
In light of this, it's quite peculiar that Perpetual Energy's P/S sits below the majority of other companies. Apparently some shareholders believe the recent performance has exceeded its limits and have been accepting significantly lower selling prices.
The Bottom Line On Perpetual Energy's P/S
While the price-to-sales ratio shouldn't be the defining factor in whether you buy a stock or not, it's quite a capable barometer of revenue expectations.
Upon analysing the past data, we see it is unexpected that Perpetual Energy is currently trading at a lower P/S than the rest of the industry given that its revenue growth in the past three-year years is exceeding expectations in a challenging industry. One assumption would be that there are some underlying risks to revenue that are keeping the P/S from rising to match the its strong performance. Amidst challenging industry conditions, perhaps a key concern is whether the company can sustain its superior revenue growth trajectory. At least the risk of a price drop looks to be subdued, but investors think future revenue could see a lot of volatility.
Before you settle on your opinion, we've discovered 4 warning signs for Perpetual Energy (1 is concerning!) that you should be aware of.
If these risks are making you reconsider your opinion on Perpetual Energy, explore our interactive list of high quality stocks to get an idea of what else is out there.
Have feedback on this article? Concerned about the content? Get in touch with us directly. Alternatively, email editorial-team (at) simplywallst.com.
This article by Simply Wall St is general in nature. We provide commentary based on historical data and analyst forecasts only using an unbiased methodology and our articles are not intended to be financial advice. It does not constitute a recommendation to buy or sell any stock, and does not take account of your objectives, or your financial situation. We aim to bring you long-term focused analysis driven by fundamental data. Note that our analysis may not factor in the latest price-sensitive company announcements or qualitative material. Simply Wall St has no position in any stocks mentioned.
Join A Paid User Research Session
You’ll receive a US$30 Amazon Gift card for 1 hour of your time while helping us build better investing tools for the individual investors like yourself. Sign up here
