
 Yahoo Finance
 Investors Holding Back On Applied UV, Inc. (NASDAQ:AUVI)
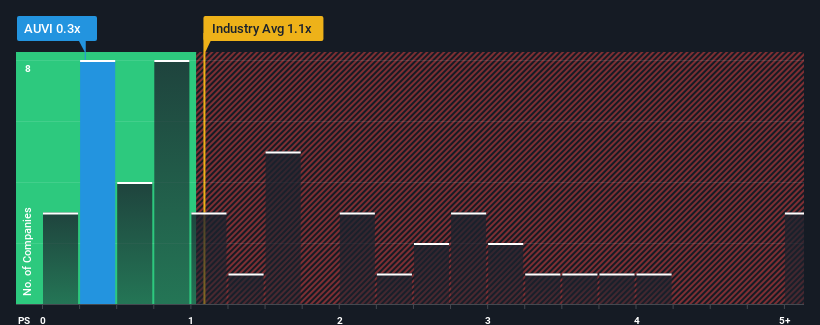
Applied UV, Inc.'s (NASDAQ:AUVI) price-to-sales (or "P/S") ratio of 0.3x may look like a pretty appealing investment opportunity when you consider close to half the companies in the Building industry in the United States have P/S ratios greater than 1.1x. However, the P/S might be low for a reason and it requires further investigation to determine if it's justified.
View our latest analysis for Applied UV
How Applied UV Has Been Performing
With revenue growth that's exceedingly strong of late, Applied UV has been doing very well. One possibility is that the P/S ratio is low because investors think this strong revenue growth might actually underperform the broader industry in the near future. If that doesn't eventuate, then existing shareholders have reason to be quite optimistic about the future direction of the share price.
We don't have analyst forecasts, but you can see how recent trends are setting up the company for the future by checking out our free report on Applied UV's earnings, revenue and cash flow.
What Are Revenue Growth Metrics Telling Us About The Low P/S?
Applied UV's P/S ratio would be typical for a company that's only expected to deliver limited growth, and importantly, perform worse than the industry.
Retrospectively, the last year delivered an exceptional 116% gain to the company's top line. The strong recent performance means it was also able to grow revenue by 201% in total over the last three years. Therefore, it's fair to say the revenue growth recently has been superb for the company.
This is in contrast to the rest of the industry, which is expected to grow by 3.8% over the next year, materially lower than the company's recent medium-term annualised growth rates.
In light of this, it's peculiar that Applied UV's P/S sits below the majority of other companies. It looks like most investors are not convinced the company can maintain its recent growth rates.
The Key Takeaway
Typically, we'd caution against reading too much into price-to-sales ratios when settling on investment decisions, though it can reveal plenty about what other market participants think about the company.
Our examination of Applied UV revealed its three-year revenue trends aren't boosting its P/S anywhere near as much as we would have predicted, given they look better than current industry expectations. Potential investors that are sceptical over continued revenue performance may be preventing the P/S ratio from matching previous strong performance. At least price risks look to be very low if recent medium-term revenue trends continue, but investors seem to think future revenue could see a lot of volatility.
It's always necessary to consider the ever-present spectre of investment risk. We've identified 5 warning signs with Applied UV, and understanding these should be part of your investment process.
If companies with solid past earnings growth is up your alley, you may wish to see this free collection of other companies with strong earnings growth and low P/E ratios.
Have feedback on this article? Concerned about the content? Get in touch with us directly. Alternatively, email editorial-team (at) simplywallst.com.
This article by Simply Wall St is general in nature. We provide commentary based on historical data and analyst forecasts only using an unbiased methodology and our articles are not intended to be financial advice. It does not constitute a recommendation to buy or sell any stock, and does not take account of your objectives, or your financial situation. We aim to bring you long-term focused analysis driven by fundamental data. Note that our analysis may not factor in the latest price-sensitive company announcements or qualitative material. Simply Wall St has no position in any stocks mentioned.
