
 Yahoo Finance
 Investors who have held Amcor (NYSE:AMCR) over the last three years have watched its earnings decline along with their investment
While not a mind-blowing move, it is good to see that the Amcor plc (NYSE:AMCR) share price has gained 11% in the last three months. But that doesn't change the fact that the returns over the last three years have been less than pleasing. After all, the share price is down 16% in the last three years, significantly under-performing the market.
Although the past week has been more reassuring for shareholders, they're still in the red over the last three years, so let's see if the underlying business has been responsible for the decline.
Check out our latest analysis for Amcor
To quote Buffett, 'Ships will sail around the world but the Flat Earth Society will flourish. There will continue to be wide discrepancies between price and value in the marketplace...' By comparing earnings per share (EPS) and share price changes over time, we can get a feel for how investor attitudes to a company have morphed over time.
During the three years that the share price fell, Amcor's earnings per share (EPS) dropped by 6.6% each year. This fall in EPS isn't far from the rate of share price decline, which was 6% per year. So it seems that investor expectations of the company are staying pretty steady, despite the disappointment. It seems like the share price is reflecting the declining earnings per share.
You can see below how EPS has changed over time (discover the exact values by clicking on the image).
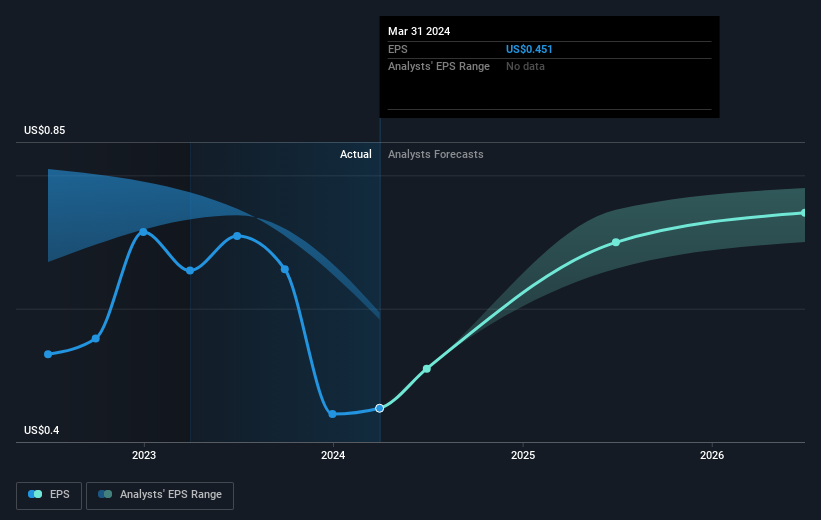
It might be well worthwhile taking a look at our free report on Amcor's earnings, revenue and cash flow.
What About Dividends?
It is important to consider the total shareholder return, as well as the share price return, for any given stock. The TSR is a return calculation that accounts for the value of cash dividends (assuming that any dividend received was reinvested) and the calculated value of any discounted capital raisings and spin-offs. So for companies that pay a generous dividend, the TSR is often a lot higher than the share price return. As it happens, Amcor's TSR for the last 3 years was -3.6%, which exceeds the share price return mentioned earlier. The dividends paid by the company have thusly boosted the total shareholder return.
A Different Perspective
Amcor shareholders gained a total return of 7.3% during the year. Unfortunately this falls short of the market return. The silver lining is that the gain was actually better than the average annual return of 3% per year over five year. This could indicate that the company is winning over new investors, as it pursues its strategy. I find it very interesting to look at share price over the long term as a proxy for business performance. But to truly gain insight, we need to consider other information, too. For example, we've discovered 2 warning signs for Amcor (1 is significant!) that you should be aware of before investing here.
If you would prefer to check out another company -- one with potentially superior financials -- then do not miss this free list of companies that have proven they can grow earnings.
Please note, the market returns quoted in this article reflect the market weighted average returns of stocks that currently trade on American exchanges.
Have feedback on this article? Concerned about the content? Get in touch with us directly. Alternatively, email editorial-team (at) simplywallst.com.
This article by Simply Wall St is general in nature. We provide commentary based on historical data and analyst forecasts only using an unbiased methodology and our articles are not intended to be financial advice. It does not constitute a recommendation to buy or sell any stock, and does not take account of your objectives, or your financial situation. We aim to bring you long-term focused analysis driven by fundamental data. Note that our analysis may not factor in the latest price-sensitive company announcements or qualitative material. Simply Wall St has no position in any stocks mentioned.
