
 Yahoo Finance
 Investors in Globe Life (NYSE:GL) have unfortunately lost 19% over the last year
Globe Life Inc. (NYSE:GL) shareholders should be happy to see the share price up 29% in the last month. But that doesn't change the fact that the returns over the last year have been less than pleasing. After all, the share price is down 19% in the last year, significantly under-performing the market.
With that in mind, it's worth seeing if the company's underlying fundamentals have been the driver of long term performance, or if there are some discrepancies.
View our latest analysis for Globe Life
There is no denying that markets are sometimes efficient, but prices do not always reflect underlying business performance. By comparing earnings per share (EPS) and share price changes over time, we can get a feel for how investor attitudes to a company have morphed over time.
During the unfortunate twelve months during which the Globe Life share price fell, it actually saw its earnings per share (EPS) improve by 17%. It's quite possible that growth expectations may have been unreasonable in the past.
The divergence between the EPS and the share price is quite notable, during the year. But we might find some different metrics explain the share price movements better.
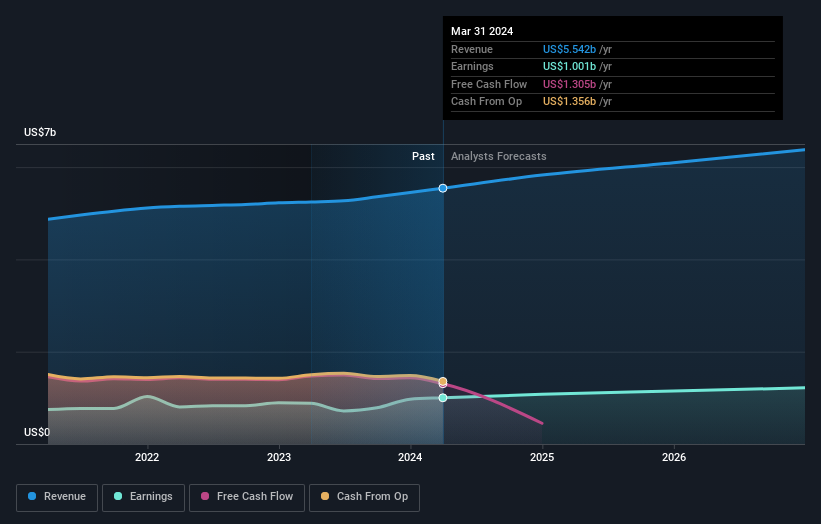
Given the yield is quite low, at 1.1%, we doubt the dividend can shed much light on the share price. Globe Life's revenue is actually up 5.7% over the last year. Since we can't easily explain the share price movement based on these metrics, it might be worth considering how market sentiment has changed towards the stock.
You can see how earnings and revenue have changed over time in the image below (click on the chart to see the exact values).
It's good to see that there was some significant insider buying in the last three months. That's a positive. On the other hand, we think the revenue and earnings trends are much more meaningful measures of the business. If you are thinking of buying or selling Globe Life stock, you should check out this free report showing analyst profit forecasts.
A Different Perspective
Investors in Globe Life had a tough year, with a total loss of 19% (including dividends), against a market gain of about 30%. Even the share prices of good stocks drop sometimes, but we want to see improvements in the fundamental metrics of a business, before getting too interested. Longer term investors wouldn't be so upset, since they would have made 0.6%, each year, over five years. It could be that the recent sell-off is an opportunity, so it may be worth checking the fundamental data for signs of a long term growth trend. It's always interesting to track share price performance over the longer term. But to understand Globe Life better, we need to consider many other factors. To that end, you should learn about the 2 warning signs we've spotted with Globe Life (including 1 which is a bit unpleasant) .
There are plenty of other companies that have insiders buying up shares. You probably do not want to miss this free list of undervalued small cap companies that insiders are buying.
Please note, the market returns quoted in this article reflect the market weighted average returns of stocks that currently trade on American exchanges.
Have feedback on this article? Concerned about the content? Get in touch with us directly. Alternatively, email editorial-team (at) simplywallst.com.
This article by Simply Wall St is general in nature. We provide commentary based on historical data and analyst forecasts only using an unbiased methodology and our articles are not intended to be financial advice. It does not constitute a recommendation to buy or sell any stock, and does not take account of your objectives, or your financial situation. We aim to bring you long-term focused analysis driven by fundamental data. Note that our analysis may not factor in the latest price-sensitive company announcements or qualitative material. Simply Wall St has no position in any stocks mentioned.