
 Yahoo Finance
 Investors in Global Industrial (NYSE:GIC) have seen respectable returns of 84% over the past five years
It hasn't been the best quarter for Global Industrial Company (NYSE:GIC) shareholders, since the share price has fallen 27% in that time. But the silver lining is the stock is up over five years. Unfortunately its return of 43% is below the market return of 100%.
Let's take a look at the underlying fundamentals over the longer term, and see if they've been consistent with shareholders returns.
Check out our latest analysis for Global Industrial
There is no denying that markets are sometimes efficient, but prices do not always reflect underlying business performance. By comparing earnings per share (EPS) and share price changes over time, we can get a feel for how investor attitudes to a company have morphed over time.
During five years of share price growth, Global Industrial achieved compound earnings per share (EPS) growth of 6.1% per year. This EPS growth is reasonably close to the 7% average annual increase in the share price. Therefore one could conclude that sentiment towards the shares hasn't morphed very much. Rather, the share price has approximately tracked EPS growth.
The company's earnings per share (over time) is depicted in the image below (click to see the exact numbers).
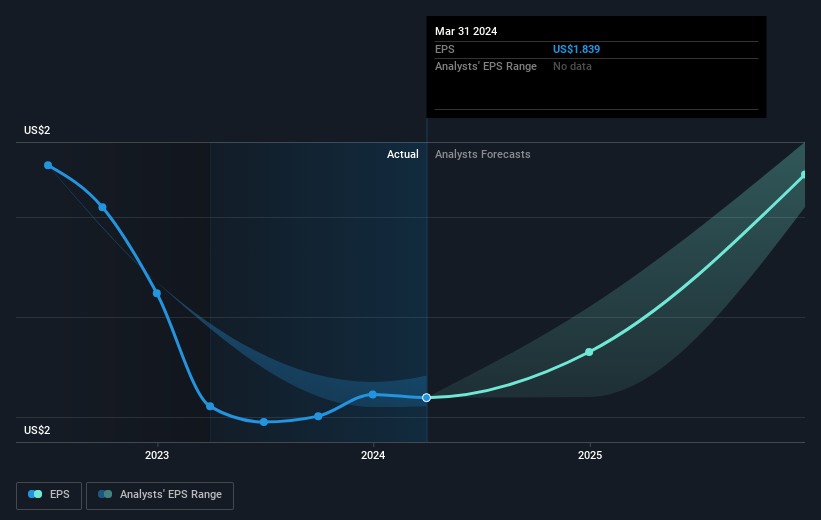
This free interactive report on Global Industrial's earnings, revenue and cash flow is a great place to start, if you want to investigate the stock further.
What About Dividends?
It is important to consider the total shareholder return, as well as the share price return, for any given stock. Whereas the share price return only reflects the change in the share price, the TSR includes the value of dividends (assuming they were reinvested) and the benefit of any discounted capital raising or spin-off. So for companies that pay a generous dividend, the TSR is often a lot higher than the share price return. In the case of Global Industrial, it has a TSR of 84% for the last 5 years. That exceeds its share price return that we previously mentioned. And there's no prize for guessing that the dividend payments largely explain the divergence!
A Different Perspective
Global Industrial shareholders gained a total return of 16% during the year. But that return falls short of the market. The silver lining is that the gain was actually better than the average annual return of 13% per year over five year. This suggests the company might be improving over time. It's always interesting to track share price performance over the longer term. But to understand Global Industrial better, we need to consider many other factors. To that end, you should be aware of the 1 warning sign we've spotted with Global Industrial .
Of course Global Industrial may not be the best stock to buy. So you may wish to see this free collection of growth stocks.
Please note, the market returns quoted in this article reflect the market weighted average returns of stocks that currently trade on American exchanges.
Have feedback on this article? Concerned about the content? Get in touch with us directly. Alternatively, email editorial-team (at) simplywallst.com.
This article by Simply Wall St is general in nature. We provide commentary based on historical data and analyst forecasts only using an unbiased methodology and our articles are not intended to be financial advice. It does not constitute a recommendation to buy or sell any stock, and does not take account of your objectives, or your financial situation. We aim to bring you long-term focused analysis driven by fundamental data. Note that our analysis may not factor in the latest price-sensitive company announcements or qualitative material. Simply Wall St has no position in any stocks mentioned.
Have feedback on this article? Concerned about the content? Get in touch with us directly. Alternatively, email editorial-team@simplywallst.com
