
 Yahoo Finance
 How Should Investors Feel About Diversified Royalty Corp.’s (TSE:DIV) CEO Pay?

Sean Morrison became the CEO of Diversified Royalty Corp. (TSE:DIV) in 2013. First, this article will compare CEO compensation with compensation at similar sized companies. Then we’ll look at a snap shot of the business growth. And finally – as a second measure of performance – we will look at the returns shareholders have received over the last few years. The aim of all this is to consider the appropriateness of CEO pay levels.
See our latest analysis for Diversified Royalty
Want to help shape the future of investing tools and platforms? Take the survey and be part of one of the most advanced studies of stock market investors to date.
How Does Sean Morrison’s Compensation Compare With Similar Sized Companies?
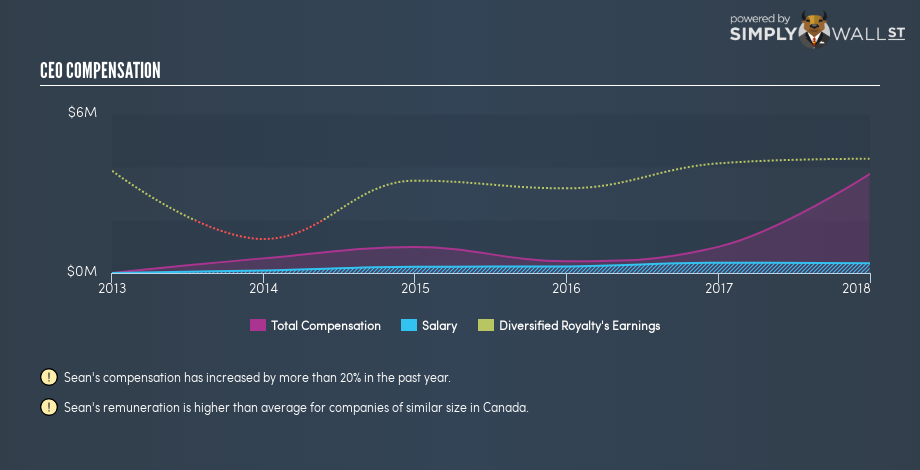
At the time of writing our data says that Diversified Royalty Corp. has a market cap of CA$308m, and is paying total annual CEO compensation of CA$3.7m. (This is based on the year to 2017). While this analysis focuses on total compensation, it’s worth noting the salary is lower, valued at CA$366k. As part of our analysis we looked at companies in the same jurisdiction, with market capitalizations of CA$134m to CA$537m. The median total CEO compensation was CA$924k.
As you can see, Sean Morrison is paid more than the median CEO pay at companies of a similar size, in the same market. However, this does not necessarily mean Diversified Royalty Corp. is paying too much. We can get a better idea of how generous the pay is by looking at the performance of the underlying business.
You can see a visual representation of the CEO compensation at Diversified Royalty, below.
Is Diversified Royalty Corp. Growing?
On average over the last three years, Diversified Royalty Corp. has grown earnings per share (EPS) by 18% each year (using a line of best fit). Its revenue is up 29% over last year.
This demonstrates that the company has been improving recently. A good result. The combination of strong revenue growth with medium-term earnings per share improvement certainly points to the kind of growth I like to see.
You might want to check this free visual report on analyst forecasts for future earnings.
Has Diversified Royalty Corp. Been A Good Investment?
Boasting a total shareholder return of 74% over three years, Diversified Royalty Corp. has done well by shareholders. So they may not be at all concerned if the CEO were to be paid more than is normal for companies around the same size.
In Summary…
We compared the total CEO remuneration paid by Diversified Royalty Corp., and compared it to remuneration at a group of similar sized companies. Our data suggests that it pays above the median CEO pay within that group.
However we must not forget that the EPS growth has been very strong over three years. Even better, returns to shareholders have been plentiful, over the same time period. As a result of this good performance, the CEO remuneration may well be quite reasonable. Shareholders may want to check for free if Diversified Royalty insiders are buying or selling shares.
Or you might prefer gaze upon this detailed graph of past earnings, revenue and cash flow .
To help readers see past the short term volatility of the financial market, we aim to bring you a long-term focused research analysis purely driven by fundamental data. Note that our analysis does not factor in the latest price-sensitive company announcements.
The author is an independent contributor and at the time of publication had no position in the stocks mentioned. For errors that warrant correction please contact the editor at editorial-team@simplywallst.com.
