
 Yahoo Finance
 Investors Should Be Encouraged By Dr. Martens' (LON:DOCS) Returns On Capital
If we want to find a stock that could multiply over the long term, what are the underlying trends we should look for? Amongst other things, we'll want to see two things; firstly, a growing return on capital employed (ROCE) and secondly, an expansion in the company's amount of capital employed. Basically this means that a company has profitable initiatives that it can continue to reinvest in, which is a trait of a compounding machine. Speaking of which, we noticed some great changes in Dr. Martens' (LON:DOCS) returns on capital, so let's have a look.
Return On Capital Employed (ROCE): What Is It?
Just to clarify if you're unsure, ROCE is a metric for evaluating how much pre-tax income (in percentage terms) a company earns on the capital invested in its business. To calculate this metric for Dr. Martens, this is the formula:
Return on Capital Employed = Earnings Before Interest and Tax (EBIT) ÷ (Total Assets - Current Liabilities)
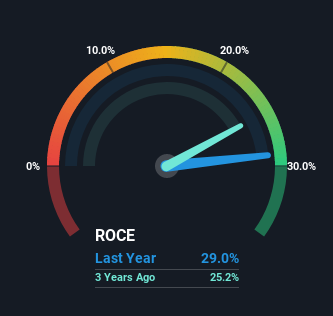
0.29 = UK£221m ÷ (UK£981m - UK£219m) (Based on the trailing twelve months to September 2022).
Therefore, Dr. Martens has an ROCE of 29%. In absolute terms that's a great return and it's even better than the Luxury industry average of 10%.
Check out our latest analysis for Dr. Martens
Above you can see how the current ROCE for Dr. Martens compares to its prior returns on capital, but there's only so much you can tell from the past. If you're interested, you can view the analysts predictions in our free report on analyst forecasts for the company.
What Can We Tell From Dr. Martens' ROCE Trend?
Investors would be pleased with what's happening at Dr. Martens. Over the last five years, returns on capital employed have risen substantially to 29%. Basically the business is earning more per dollar of capital invested and in addition to that, 100% more capital is being employed now too. This can indicate that there's plenty of opportunities to invest capital internally and at ever higher rates, a combination that's common among multi-baggers.
On a side note, we noticed that the improvement in ROCE appears to be partly fueled by an increase in current liabilities. Essentially the business now has suppliers or short-term creditors funding about 22% of its operations, which isn't ideal. It's worth keeping an eye on this because as the percentage of current liabilities to total assets increases, some aspects of risk also increase.
What We Can Learn From Dr. Martens' ROCE
To sum it up, Dr. Martens has proven it can reinvest in the business and generate higher returns on that capital employed, which is terrific. Astute investors may have an opportunity here because the stock has declined 53% in the last year. That being the case, research into the company's current valuation metrics and future prospects seems fitting.
If you want to continue researching Dr. Martens, you might be interested to know about the 3 warning signs that our analysis has discovered.
If you'd like to see other companies earning high returns, check out our free list of companies earning high returns with solid balance sheets here.
Have feedback on this article? Concerned about the content? Get in touch with us directly. Alternatively, email editorial-team (at) simplywallst.com.
This article by Simply Wall St is general in nature. We provide commentary based on historical data and analyst forecasts only using an unbiased methodology and our articles are not intended to be financial advice. It does not constitute a recommendation to buy or sell any stock, and does not take account of your objectives, or your financial situation. We aim to bring you long-term focused analysis driven by fundamental data. Note that our analysis may not factor in the latest price-sensitive company announcements or qualitative material. Simply Wall St has no position in any stocks mentioned.
Join A Paid User Research Session
You’ll receive a US$30 Amazon Gift card for 1 hour of your time while helping us build better investing tools for the individual investors like yourself. Sign up here
