
 Yahoo Finance
 Investors in e.l.f. Beauty (NYSE:ELF) have seen massive returns of 433% over the past three years
We think that it's fair to say that the possibility of finding fantastic multi-year winners is what motivates many investors. Mistakes are inevitable, but a single top stock pick can cover any losses, and so much more. Take, for example, the e.l.f. Beauty, Inc. (NYSE:ELF) share price, which skyrocketed 433% over three years. On top of that, the share price is up 22% in about a quarter.
So let's investigate and see if the longer term performance of the company has been in line with the underlying business' progress.
See our latest analysis for e.l.f. Beauty
In his essay The Superinvestors of Graham-and-Doddsville Warren Buffett described how share prices do not always rationally reflect the value of a business. One imperfect but simple way to consider how the market perception of a company has shifted is to compare the change in the earnings per share (EPS) with the share price movement.
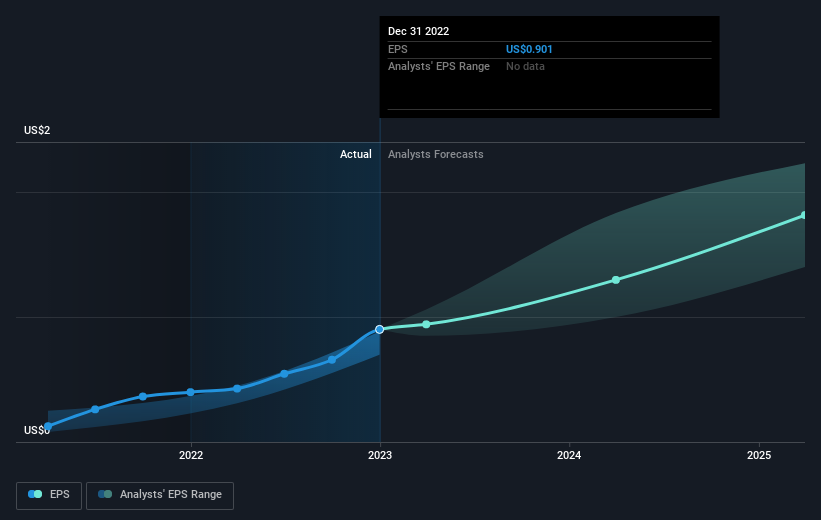
During three years of share price growth, e.l.f. Beauty achieved compound earnings per share growth of 415% per year. This EPS growth is higher than the 75% average annual increase in the share price. Therefore, it seems the market has moderated its expectations for growth, somewhat. Having said that, the market is still optimistic, given the P/E ratio of 102.19.
The company's earnings per share (over time) is depicted in the image below (click to see the exact numbers).
It is of course excellent to see how e.l.f. Beauty has grown profits over the years, but the future is more important for shareholders. You can see how its balance sheet has strengthened (or weakened) over time in this free interactive graphic.
A Different Perspective
It's nice to see that e.l.f. Beauty shareholders have received a total shareholder return of 323% over the last year. Since the one-year TSR is better than the five-year TSR (the latter coming in at 36% per year), it would seem that the stock's performance has improved in recent times. Someone with an optimistic perspective could view the recent improvement in TSR as indicating that the business itself is getting better with time. It's always interesting to track share price performance over the longer term. But to understand e.l.f. Beauty better, we need to consider many other factors. Take risks, for example - e.l.f. Beauty has 2 warning signs we think you should be aware of.
But note: e.l.f. Beauty may not be the best stock to buy. So take a peek at this free list of interesting companies with past earnings growth (and further growth forecast).
Please note, the market returns quoted in this article reflect the market weighted average returns of stocks that currently trade on American exchanges.
Have feedback on this article? Concerned about the content? Get in touch with us directly. Alternatively, email editorial-team (at) simplywallst.com.
This article by Simply Wall St is general in nature. We provide commentary based on historical data and analyst forecasts only using an unbiased methodology and our articles are not intended to be financial advice. It does not constitute a recommendation to buy or sell any stock, and does not take account of your objectives, or your financial situation. We aim to bring you long-term focused analysis driven by fundamental data. Note that our analysis may not factor in the latest price-sensitive company announcements or qualitative material. Simply Wall St has no position in any stocks mentioned.
Join A Paid User Research Session
You’ll receive a US$30 Amazon Gift card for 1 hour of your time while helping us build better investing tools for the individual investors like yourself. Sign up here
