
 Yahoo Finance
 Investors in Dufry (VTX:DUFN) have unfortunately lost 70% over the last five years
While not a mind-blowing move, it is good to see that the Dufry AG (VTX:DUFN) share price has gained 21% in the last three months. But that is little comfort to those holding over the last half decade, sitting on a big loss. The share price has failed to impress anyone , down a sizable 73% during that time. So we're not so sure if the recent bounce should be celebrated. But it could be that the fall was overdone.
Now let's have a look at the company's fundamentals, and see if the long term shareholder return has matched the performance of the underlying business.
Check out our latest analysis for Dufry
In his essay The Superinvestors of Graham-and-Doddsville Warren Buffett described how share prices do not always rationally reflect the value of a business. One way to examine how market sentiment has changed over time is to look at the interaction between a company's share price and its earnings per share (EPS).
During five years of share price growth, Dufry moved from a loss to profitability. Most would consider that to be a good thing, so it's counter-intuitive to see the share price declining. Other metrics might give us a better handle on how its value is changing over time.
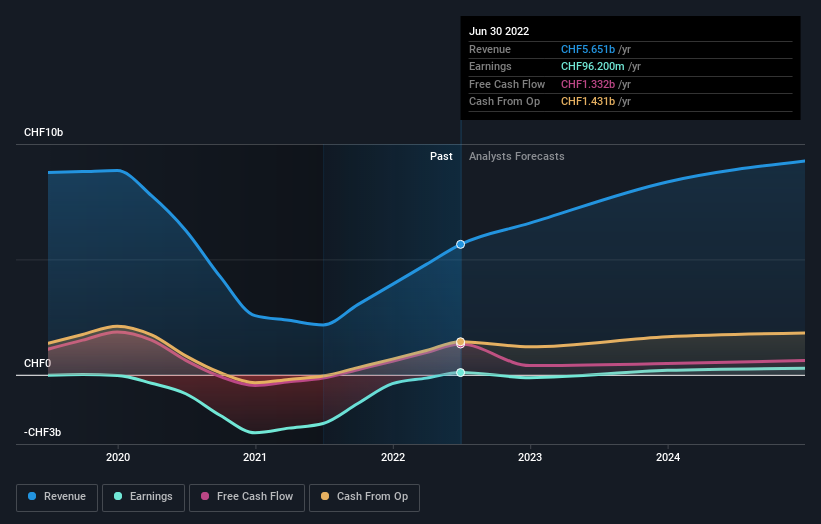
It could be that the revenue decline of 19% per year is viewed as evidence that Dufry is shrinking. That could explain the weak share price.
You can see below how earnings and revenue have changed over time (discover the exact values by clicking on the image).
Dufry is well known by investors, and plenty of clever analysts have tried to predict the future profit levels. Given we have quite a good number of analyst forecasts, it might be well worth checking out this free chart depicting consensus estimates.
What About The Total Shareholder Return (TSR)?
We've already covered Dufry's share price action, but we should also mention its total shareholder return (TSR). The TSR is a return calculation that accounts for the value of cash dividends (assuming that any dividend received was reinvested) and the calculated value of any discounted capital raisings and spin-offs. Dufry's TSR of was a loss of 70% for the 5 years. That wasn't as bad as its share price return, because it has paid dividends.
A Different Perspective
While it's never nice to take a loss, Dufry shareholders can take comfort that their trailing twelve month loss of 14% wasn't as bad as the market loss of around 17%. What is more upsetting is the 11% per annum loss investors have suffered over the last half decade. This sort of share price action isn't particularly encouraging, but at least the losses are slowing. While it is well worth considering the different impacts that market conditions can have on the share price, there are other factors that are even more important. Even so, be aware that Dufry is showing 2 warning signs in our investment analysis , you should know about...
But note: Dufry may not be the best stock to buy. So take a peek at this free list of interesting companies with past earnings growth (and further growth forecast).
Please note, the market returns quoted in this article reflect the market weighted average returns of stocks that currently trade on CH exchanges.
Have feedback on this article? Concerned about the content? Get in touch with us directly. Alternatively, email editorial-team (at) simplywallst.com.
This article by Simply Wall St is general in nature. We provide commentary based on historical data and analyst forecasts only using an unbiased methodology and our articles are not intended to be financial advice. It does not constitute a recommendation to buy or sell any stock, and does not take account of your objectives, or your financial situation. We aim to bring you long-term focused analysis driven by fundamental data. Note that our analysis may not factor in the latest price-sensitive company announcements or qualitative material. Simply Wall St has no position in any stocks mentioned.
Join A Paid User Research Session
You’ll receive a US$30 Amazon Gift card for 1 hour of your time while helping us build better investing tools for the individual investors like yourself. Sign up here
