
 Yahoo Finance
 Investors in Cross Country Healthcare (NASDAQ:CCRN) have seen notable returns of 96% over the past five years
It hasn't been the best quarter for Cross Country Healthcare, Inc. (NASDAQ:CCRN) shareholders, since the share price has fallen 20% in that time. But the silver lining is the stock is up over five years. In that time, it is up 96%, which isn't bad, but is below the market return of 98%. While the long term returns are impressive, we do have some sympathy for those who bought more recently, given the 43% drop, in the last year.
With that in mind, it's worth seeing if the company's underlying fundamentals have been the driver of long term performance, or if there are some discrepancies.
See our latest analysis for Cross Country Healthcare
In his essay The Superinvestors of Graham-and-Doddsville Warren Buffett described how share prices do not always rationally reflect the value of a business. One way to examine how market sentiment has changed over time is to look at the interaction between a company's share price and its earnings per share (EPS).
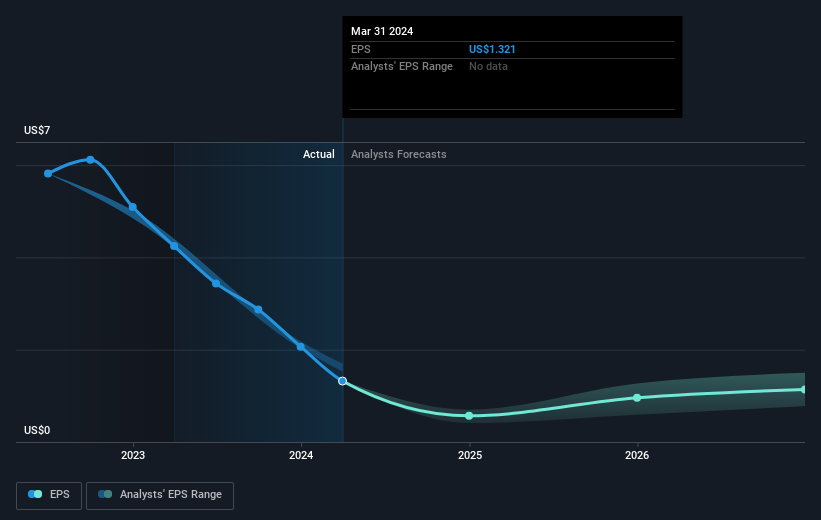
During the five years of share price growth, Cross Country Healthcare moved from a loss to profitability. That would generally be considered a positive, so we'd hope to see the share price to rise. Since the company was unprofitable five years ago, but not three years ago, it's worth taking a look at the returns in the last three years, too. We can see that the Cross Country Healthcare share price is down 9.1% in the last three years. In the same period, EPS is up 77% per year. It would appear there's a real mismatch between the increasing EPS and the share price, which has declined -3.1% a year for three years.
The image below shows how EPS has tracked over time (if you click on the image you can see greater detail).
We know that Cross Country Healthcare has improved its bottom line over the last three years, but what does the future have in store? You can see how its balance sheet has strengthened (or weakened) over time in this free interactive graphic.
A Different Perspective
Investors in Cross Country Healthcare had a tough year, with a total loss of 43%, against a market gain of about 27%. However, keep in mind that even the best stocks will sometimes underperform the market over a twelve month period. On the bright side, long term shareholders have made money, with a gain of 14% per year over half a decade. It could be that the recent sell-off is an opportunity, so it may be worth checking the fundamental data for signs of a long term growth trend. It's always interesting to track share price performance over the longer term. But to understand Cross Country Healthcare better, we need to consider many other factors. For instance, we've identified 3 warning signs for Cross Country Healthcare (1 shouldn't be ignored) that you should be aware of.
Of course, you might find a fantastic investment by looking elsewhere. So take a peek at this free list of companies we expect will grow earnings.
Please note, the market returns quoted in this article reflect the market weighted average returns of stocks that currently trade on American exchanges.
Have feedback on this article? Concerned about the content? Get in touch with us directly. Alternatively, email editorial-team (at) simplywallst.com.
This article by Simply Wall St is general in nature. We provide commentary based on historical data and analyst forecasts only using an unbiased methodology and our articles are not intended to be financial advice. It does not constitute a recommendation to buy or sell any stock, and does not take account of your objectives, or your financial situation. We aim to bring you long-term focused analysis driven by fundamental data. Note that our analysis may not factor in the latest price-sensitive company announcements or qualitative material. Simply Wall St has no position in any stocks mentioned.
