
 Yahoo Finance
 Investors Could Be Concerned With TEGNA's (NYSE:TGNA) Returns On Capital
Finding a business that has the potential to grow substantially is not easy, but it is possible if we look at a few key financial metrics. In a perfect world, we'd like to see a company investing more capital into its business and ideally the returns earned from that capital are also increasing. Put simply, these types of businesses are compounding machines, meaning they are continually reinvesting their earnings at ever-higher rates of return. However, after investigating TEGNA (NYSE:TGNA), we don't think it's current trends fit the mold of a multi-bagger.
Return On Capital Employed (ROCE): What Is It?
For those who don't know, ROCE is a measure of a company's yearly pre-tax profit (its return), relative to the capital employed in the business. The formula for this calculation on TEGNA is:
Return on Capital Employed = Earnings Before Interest and Tax (EBIT) ÷ (Total Assets - Current Liabilities)
0.088 = US$586m ÷ (US$7.1b - US$434m) (Based on the trailing twelve months to March 2024).
Thus, TEGNA has an ROCE of 8.8%. On its own, that's a low figure but it's around the 11% average generated by the Media industry.
View our latest analysis for TEGNA
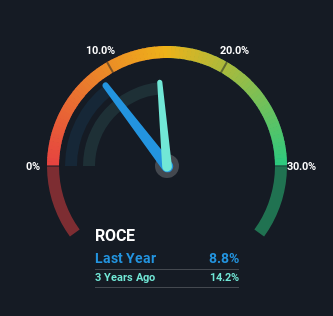
Above you can see how the current ROCE for TEGNA compares to its prior returns on capital, but there's only so much you can tell from the past. If you'd like, you can check out the forecasts from the analysts covering TEGNA for free.
So How Is TEGNA's ROCE Trending?
On the surface, the trend of ROCE at TEGNA doesn't inspire confidence. Around five years ago the returns on capital were 14%, but since then they've fallen to 8.8%. Given the business is employing more capital while revenue has slipped, this is a bit concerning. This could mean that the business is losing its competitive advantage or market share, because while more money is being put into ventures, it's actually producing a lower return - "less bang for their buck" per se.
The Bottom Line On TEGNA's ROCE
We're a bit apprehensive about TEGNA because despite more capital being deployed in the business, returns on that capital and sales have both fallen. Investors must expect better things on the horizon though because the stock has risen 6.3% in the last five years. Either way, we aren't huge fans of the current trends and so with that we think you might find better investments elsewhere.
TEGNA does come with some risks though, we found 5 warning signs in our investment analysis, and 2 of those are significant...
While TEGNA isn't earning the highest return, check out this free list of companies that are earning high returns on equity with solid balance sheets.
Have feedback on this article? Concerned about the content? Get in touch with us directly. Alternatively, email editorial-team (at) simplywallst.com.
This article by Simply Wall St is general in nature. We provide commentary based on historical data and analyst forecasts only using an unbiased methodology and our articles are not intended to be financial advice. It does not constitute a recommendation to buy or sell any stock, and does not take account of your objectives, or your financial situation. We aim to bring you long-term focused analysis driven by fundamental data. Note that our analysis may not factor in the latest price-sensitive company announcements or qualitative material. Simply Wall St has no position in any stocks mentioned.
