
 Yahoo Finance
 Investors Could Be Concerned With Cineplex's (TSE:CGX) Returns On Capital
What are the early trends we should look for to identify a stock that could multiply in value over the long term? Typically, we'll want to notice a trend of growing return on capital employed (ROCE) and alongside that, an expanding base of capital employed. Ultimately, this demonstrates that it's a business that is reinvesting profits at increasing rates of return. Although, when we looked at Cineplex (TSE:CGX), it didn't seem to tick all of these boxes.
Understanding Return On Capital Employed (ROCE)
For those who don't know, ROCE is a measure of a company's yearly pre-tax profit (its return), relative to the capital employed in the business. Analysts use this formula to calculate it for Cineplex:
Return on Capital Employed = Earnings Before Interest and Tax (EBIT) ÷ (Total Assets - Current Liabilities)
0.033 = CA$54m ÷ (CA$2.2b - CA$516m) (Based on the trailing twelve months to December 2022).
Thus, Cineplex has an ROCE of 3.3%. In absolute terms, that's a low return and it also under-performs the Entertainment industry average of 8.4%.
View our latest analysis for Cineplex
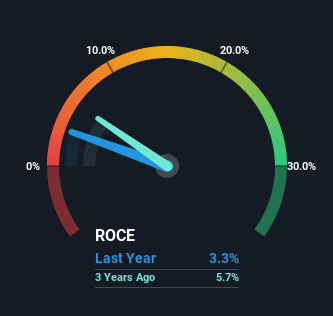
Above you can see how the current ROCE for Cineplex compares to its prior returns on capital, but there's only so much you can tell from the past. If you're interested, you can view the analysts predictions in our free report on analyst forecasts for the company.
What Does the ROCE Trend For Cineplex Tell Us?
On the surface, the trend of ROCE at Cineplex doesn't inspire confidence. Around five years ago the returns on capital were 8.7%, but since then they've fallen to 3.3%. Although, given both revenue and the amount of assets employed in the business have increased, it could suggest the company is investing in growth, and the extra capital has led to a short-term reduction in ROCE. And if the increased capital generates additional returns, the business, and thus shareholders, will benefit in the long run.
The Bottom Line
Even though returns on capital have fallen in the short term, we find it promising that revenue and capital employed have both increased for Cineplex. These growth trends haven't led to growth returns though, since the stock has fallen 69% over the last five years. As a result, we'd recommend researching this stock further to uncover what other fundamentals of the business can show us.
One final note, you should learn about the 3 warning signs we've spotted with Cineplex (including 2 which shouldn't be ignored) .
For those who like to invest in solid companies, check out this free list of companies with solid balance sheets and high returns on equity.
Have feedback on this article? Concerned about the content? Get in touch with us directly. Alternatively, email editorial-team (at) simplywallst.com.
This article by Simply Wall St is general in nature. We provide commentary based on historical data and analyst forecasts only using an unbiased methodology and our articles are not intended to be financial advice. It does not constitute a recommendation to buy or sell any stock, and does not take account of your objectives, or your financial situation. We aim to bring you long-term focused analysis driven by fundamental data. Note that our analysis may not factor in the latest price-sensitive company announcements or qualitative material. Simply Wall St has no position in any stocks mentioned.
Join A Paid User Research Session
You’ll receive a US$30 Amazon Gift card for 1 hour of your time while helping us build better investing tools for the individual investors like yourself. Sign up here
