
 Yahoo Finance
 Investors in Citigroup (NYSE:C) have unfortunately lost 26% over the last three years
Many investors define successful investing as beating the market average over the long term. But the risk of stock picking is that you will likely buy under-performing companies. Unfortunately, that's been the case for longer term Citigroup Inc. (NYSE:C) shareholders, since the share price is down 34% in the last three years, falling well short of the market return of around 27%.
It's worthwhile assessing if the company's economics have been moving in lockstep with these underwhelming shareholder returns, or if there is some disparity between the two. So let's do just that.
See our latest analysis for Citigroup
To quote Buffett, 'Ships will sail around the world but the Flat Earth Society will flourish. There will continue to be wide discrepancies between price and value in the marketplace...' One imperfect but simple way to consider how the market perception of a company has shifted is to compare the change in the earnings per share (EPS) with the share price movement.
Citigroup saw its EPS decline at a compound rate of 4.4% per year, over the last three years. This reduction in EPS is slower than the 13% annual reduction in the share price. So it seems the market was too confident about the business, in the past. The less favorable sentiment is reflected in its current P/E ratio of 7.30.
You can see below how EPS has changed over time (discover the exact values by clicking on the image).
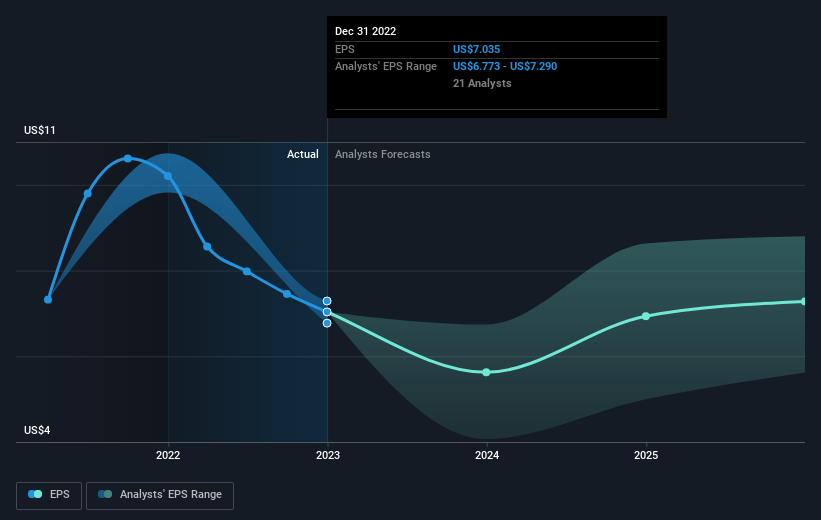
Before buying or selling a stock, we always recommend a close examination of historic growth trends, available here.
What About Dividends?
When looking at investment returns, it is important to consider the difference between total shareholder return (TSR) and share price return. The TSR is a return calculation that accounts for the value of cash dividends (assuming that any dividend received was reinvested) and the calculated value of any discounted capital raisings and spin-offs. So for companies that pay a generous dividend, the TSR is often a lot higher than the share price return. As it happens, Citigroup's TSR for the last 3 years was -26%, which exceeds the share price return mentioned earlier. This is largely a result of its dividend payments!
A Different Perspective
We regret to report that Citigroup shareholders are down 20% for the year (even including dividends). Unfortunately, that's worse than the broader market decline of 8.6%. Having said that, it's inevitable that some stocks will be oversold in a falling market. The key is to keep your eyes on the fundamental developments. Unfortunately, last year's performance may indicate unresolved challenges, given that it was worse than the annualised loss of 4% over the last half decade. Generally speaking long term share price weakness can be a bad sign, though contrarian investors might want to research the stock in hope of a turnaround. I find it very interesting to look at share price over the long term as a proxy for business performance. But to truly gain insight, we need to consider other information, too. Consider risks, for instance. Every company has them, and we've spotted 1 warning sign for Citigroup you should know about.
But note: Citigroup may not be the best stock to buy. So take a peek at this free list of interesting companies with past earnings growth (and further growth forecast).
Please note, the market returns quoted in this article reflect the market weighted average returns of stocks that currently trade on US exchanges.
Have feedback on this article? Concerned about the content? Get in touch with us directly. Alternatively, email editorial-team (at) simplywallst.com.
This article by Simply Wall St is general in nature. We provide commentary based on historical data and analyst forecasts only using an unbiased methodology and our articles are not intended to be financial advice. It does not constitute a recommendation to buy or sell any stock, and does not take account of your objectives, or your financial situation. We aim to bring you long-term focused analysis driven by fundamental data. Note that our analysis may not factor in the latest price-sensitive company announcements or qualitative material. Simply Wall St has no position in any stocks mentioned.
Join A Paid User Research Session
You’ll receive a US$30 Amazon Gift card for 1 hour of your time while helping us build better investing tools for the individual investors like yourself. Sign up here
