
 Yahoo Finance
 Investors in Chemung Financial (NASDAQ:CHMG) have seen returns of 24% over the past year
There's no doubt that investing in the stock market is a truly brilliant way to build wealth. But if when you choose to buy stocks, some of them will be below average performers. Over the last year the Chemung Financial Corporation (NASDAQ:CHMG) share price is up 20%, but that's less than the broader market return. However, the longer term returns haven't been so impressive, with the stock up just 5.6% in the last three years.
So let's assess the underlying fundamentals over the last 1 year and see if they've moved in lock-step with shareholder returns.
View our latest analysis for Chemung Financial
While markets are a powerful pricing mechanism, share prices reflect investor sentiment, not just underlying business performance. By comparing earnings per share (EPS) and share price changes over time, we can get a feel for how investor attitudes to a company have morphed over time.
During the last year, Chemung Financial actually saw its earnings per share drop 16%.
Given the share price gain, we doubt the market is measuring progress with EPS. Therefore, it seems likely that investors are putting more weight on metrics other than EPS, at the moment.
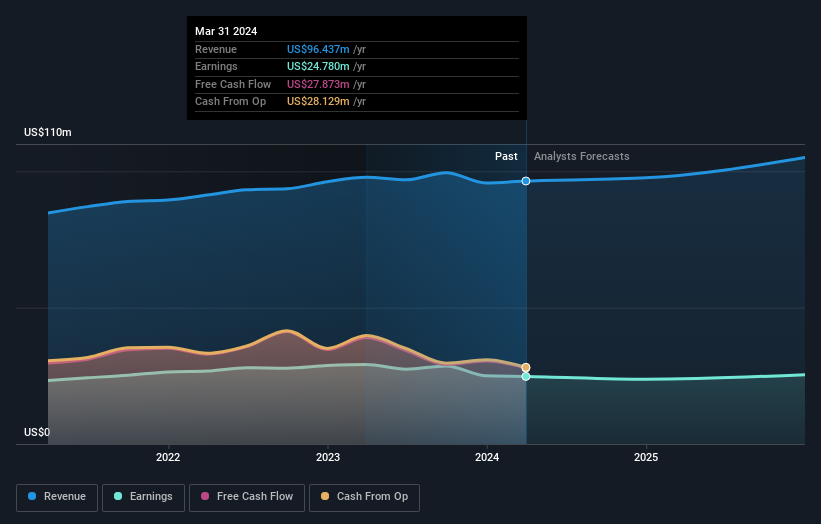
Revenue was pretty stable on last year, so deeper research might be needed to explain the share price rise.
The image below shows how earnings and revenue have tracked over time (if you click on the image you can see greater detail).
This free interactive report on Chemung Financial's balance sheet strength is a great place to start, if you want to investigate the stock further.
What About Dividends?
As well as measuring the share price return, investors should also consider the total shareholder return (TSR). Whereas the share price return only reflects the change in the share price, the TSR includes the value of dividends (assuming they were reinvested) and the benefit of any discounted capital raising or spin-off. So for companies that pay a generous dividend, the TSR is often a lot higher than the share price return. We note that for Chemung Financial the TSR over the last 1 year was 24%, which is better than the share price return mentioned above. This is largely a result of its dividend payments!
A Different Perspective
Chemung Financial provided a TSR of 24% over the year (including dividends). That's fairly close to the broader market return. Most would be happy with a gain, and it helps that the year's return is actually better than the average return over five years, which was 1.7%. It is possible that management foresight will bring growth well into the future, even if the share price slows down. If you would like to research Chemung Financial in more detail then you might want to take a look at whether insiders have been buying or selling shares in the company.
But note: Chemung Financial may not be the best stock to buy. So take a peek at this free list of interesting companies with past earnings growth (and further growth forecast).
Please note, the market returns quoted in this article reflect the market weighted average returns of stocks that currently trade on American exchanges.
Have feedback on this article? Concerned about the content? Get in touch with us directly. Alternatively, email editorial-team (at) simplywallst.com.
This article by Simply Wall St is general in nature. We provide commentary based on historical data and analyst forecasts only using an unbiased methodology and our articles are not intended to be financial advice. It does not constitute a recommendation to buy or sell any stock, and does not take account of your objectives, or your financial situation. We aim to bring you long-term focused analysis driven by fundamental data. Note that our analysis may not factor in the latest price-sensitive company announcements or qualitative material. Simply Wall St has no position in any stocks mentioned.
Have feedback on this article? Concerned about the content? Get in touch with us directly. Alternatively, email editorial-team@simplywallst.com
