
 Yahoo Finance
 Investors in Cardinal Energy (TSE:CJ) have made a splendid return of 244% over the past three years
It hasn't been the best quarter for Cardinal Energy Ltd. (TSE:CJ) shareholders, since the share price has fallen 15% in that time. But that doesn't change the fact that the returns over the last three years have been very strong. The share price marched upwards over that time, and is now 223% higher than it was. So the recent fall in the share price should be viewed in that context. Only time will tell if there is still too much optimism currently reflected in the share price.
Let's take a look at the underlying fundamentals over the longer term, and see if they've been consistent with shareholders returns.
Check out our latest analysis for Cardinal Energy
To paraphrase Benjamin Graham: Over the short term the market is a voting machine, but over the long term it's a weighing machine. By comparing earnings per share (EPS) and share price changes over time, we can get a feel for how investor attitudes to a company have morphed over time.
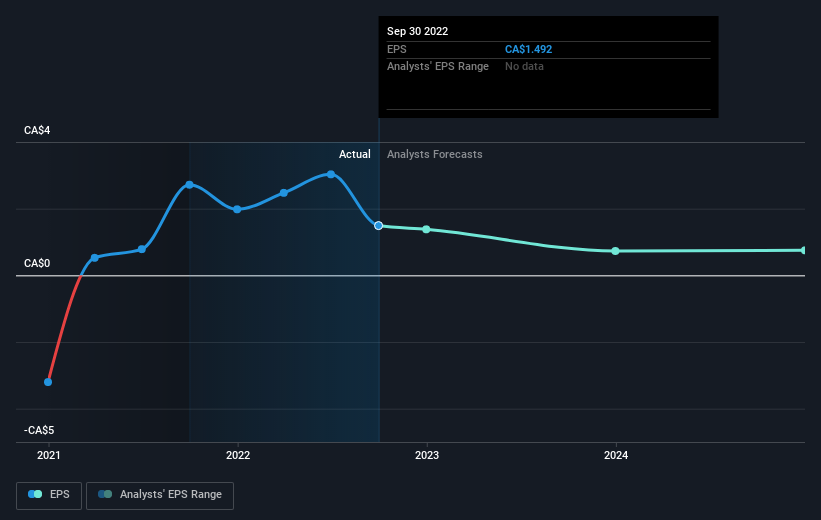
During three years of share price growth, Cardinal Energy achieved compound earnings per share growth of 37% per year. In comparison, the 48% per year gain in the share price outpaces the EPS growth. So it's fair to assume the market has a higher opinion of the business than it did three years ago. That's not necessarily surprising considering the three-year track record of earnings growth.
The image below shows how EPS has tracked over time (if you click on the image you can see greater detail).
It's good to see that there was some significant insider buying in the last three months. That's a positive. That said, we think earnings and revenue growth trends are even more important factors to consider. Dive deeper into the earnings by checking this interactive graph of Cardinal Energy's earnings, revenue and cash flow.
What About Dividends?
When looking at investment returns, it is important to consider the difference between total shareholder return (TSR) and share price return. Whereas the share price return only reflects the change in the share price, the TSR includes the value of dividends (assuming they were reinvested) and the benefit of any discounted capital raising or spin-off. It's fair to say that the TSR gives a more complete picture for stocks that pay a dividend. In the case of Cardinal Energy, it has a TSR of 244% for the last 3 years. That exceeds its share price return that we previously mentioned. The dividends paid by the company have thusly boosted the total shareholder return.
A Different Perspective
We're pleased to report that Cardinal Energy shareholders have received a total shareholder return of 52% over one year. Of course, that includes the dividend. That's better than the annualised return of 17% over half a decade, implying that the company is doing better recently. In the best case scenario, this may hint at some real business momentum, implying that now could be a great time to delve deeper. It's always interesting to track share price performance over the longer term. But to understand Cardinal Energy better, we need to consider many other factors. For example, we've discovered 3 warning signs for Cardinal Energy that you should be aware of before investing here.
There are plenty of other companies that have insiders buying up shares. You probably do not want to miss this free list of growing companies that insiders are buying.
Please note, the market returns quoted in this article reflect the market weighted average returns of stocks that currently trade on CA exchanges.
Have feedback on this article? Concerned about the content? Get in touch with us directly. Alternatively, email editorial-team (at) simplywallst.com.
This article by Simply Wall St is general in nature. We provide commentary based on historical data and analyst forecasts only using an unbiased methodology and our articles are not intended to be financial advice. It does not constitute a recommendation to buy or sell any stock, and does not take account of your objectives, or your financial situation. We aim to bring you long-term focused analysis driven by fundamental data. Note that our analysis may not factor in the latest price-sensitive company announcements or qualitative material. Simply Wall St has no position in any stocks mentioned.
Join A Paid User Research Session
You’ll receive a US$30 Amazon Gift card for 1 hour of your time while helping us build better investing tools for the individual investors like yourself. Sign up here
