
 Yahoo Finance
 Investors Who Bought NovaTeqni Technology (CVE:NTQ) Shares Five Years Ago Are Now Down 97%

Some stocks are best avoided. We really hate to see fellow investors lose their hard-earned money. For example, we sympathize with anyone who was caught holding NovaTeqni Technology Corporation (CVE:NTQ) during the five years that saw its share price drop a whopping 97%. We also note that the stock has performed poorly over the last year, with the share price down 55%. Even worse, it's down 33% in about a month, which isn't fun at all.
We really hope anyone holding through that price crash has a diversified portfolio. Even when you lose money, you don't have to lose the lesson.
View our latest analysis for NovaTeqni Technology
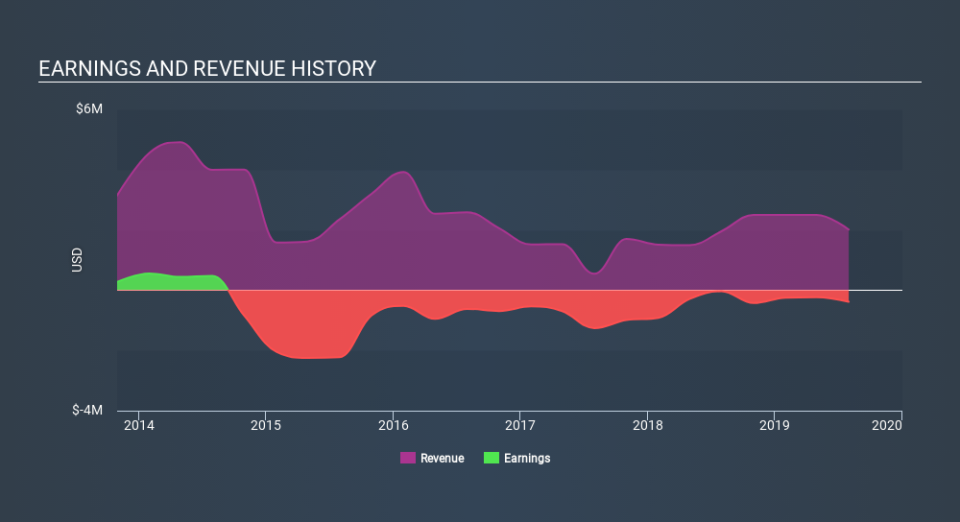
Given that NovaTeqni Technology didn't make a profit in the last twelve months, we'll focus on revenue growth to form a quick view of its business development. Generally speaking, companies without profits are expected to grow revenue every year, and at a good clip. Some companies are willing to postpone profitability to grow revenue faster, but in that case one does expect good top-line growth.
In the last five years NovaTeqni Technology saw its revenue shrink by 11% per year. That's definitely a weaker result than most pre-profit companies report. So it's not altogether surprising to see the share price down 49% per year in the same time period. This kind of price performance makes us very wary, especially when combined with falling revenue. Of course, the poor performance could mean the market has been too severe selling down. That can happen.
The graphic below depicts how earnings and revenue have changed over time (unveil the exact values by clicking on the image).
You can see how its balance sheet has strengthened (or weakened) over time in this free interactive graphic.
A Different Perspective
Investors in NovaTeqni Technology had a tough year, with a total loss of 55%, against a market gain of about 12%. Even the share prices of good stocks drop sometimes, but we want to see improvements in the fundamental metrics of a business, before getting too interested. Unfortunately, last year's performance may indicate unresolved challenges, given that it was worse than the annualised loss of 49% over the last half decade. We realise that Buffett has said investors should 'buy when there is blood on the streets', but we caution that investors should first be sure they are buying a high quality businesses. You could get a better understanding of NovaTeqni Technology's growth by checking out this more detailed historical graph of earnings, revenue and cash flow.
Of course NovaTeqni Technology may not be the best stock to buy. So you may wish to see this free collection of growth stocks.
Please note, the market returns quoted in this article reflect the market weighted average returns of stocks that currently trade on CA exchanges.
If you spot an error that warrants correction, please contact the editor at editorial-team@simplywallst.com. This article by Simply Wall St is general in nature. It does not constitute a recommendation to buy or sell any stock, and does not take account of your objectives, or your financial situation. Simply Wall St has no position in the stocks mentioned.
We aim to bring you long-term focused research analysis driven by fundamental data. Note that our analysis may not factor in the latest price-sensitive company announcements or qualitative material. Thank you for reading.
