
 Yahoo Finance
 Investors Who Bought Emera (TSE:EMA) Shares Five Years Ago Are Now Up 43%

Stock pickers are generally looking for stocks that will outperform the broader market. Buying under-rated businesses is one path to excess returns. For example, long term Emera Incorporated (TSE:EMA) shareholders have enjoyed a 43% share price rise over the last half decade, well in excess of the market return of around 4.9% (not including dividends). However, more recent returns haven’t been as impressive as that, with the stock returning just 23% in the last year, including dividends.
Check out our latest analysis for Emera
To quote Buffett, ‘Ships will sail around the world but the Flat Earth Society will flourish. There will continue to be wide discrepancies between price and value in the marketplace…’ One way to examine how market sentiment has changed over time is to look at the interaction between a company’s share price and its earnings per share (EPS).
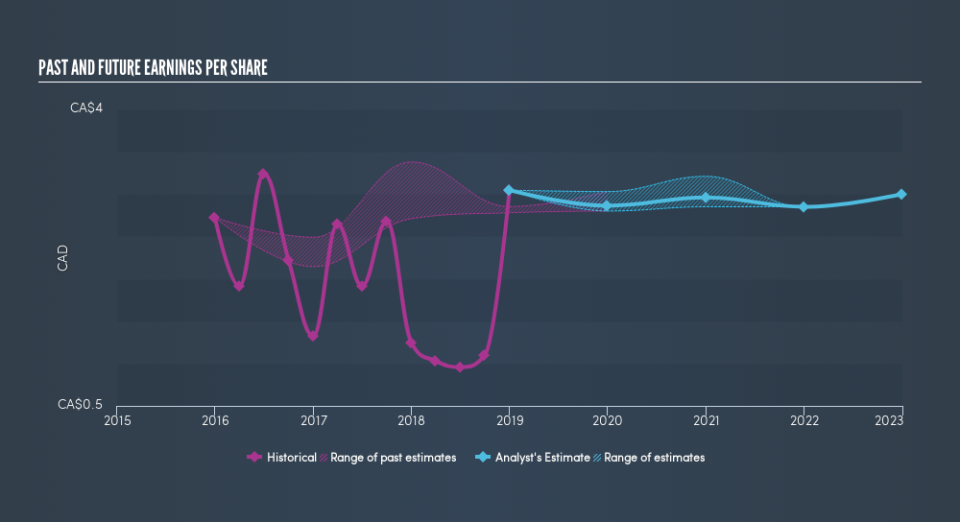
Over half a decade, Emera managed to grow its earnings per share at 13% a year. This EPS growth is higher than the 7.4% average annual increase in the share price. Therefore, it seems the market has become relatively pessimistic about the company.
The company’s earnings per share (over time) is depicted in the image below (click to see the exact numbers).
We like that insiders have been buying shares in the last twelve months. Even so, future earnings will be far more important to whether current shareholders make money. This free interactive report on Emera’s earnings, revenue and cash flow is a great place to start, if you want to investigate the stock further.
What About Dividends?
When looking at investment returns, it is important to consider the difference between total shareholder return (TSR) and share price return. Whereas the share price return only reflects the change in the share price, the TSR includes the value of dividends (assuming they were reinvested) and the benefit of any discounted capital raising. So for companies that pay a generous dividend, the TSR is often a lot higher than the share price return. In the case of Emera, it has a TSR of 79% for the last 5 years. That exceeds its share price return that we previously mentioned. And there’s no prize for guessing that the dividend payments largely explain the divergence!
A Different Perspective
It’s nice to see that Emera shareholders have received a total shareholder return of 23% over the last year. And that does include the dividend. That gain is better than the annual TSR over five years, which is 12%. Therefore it seems like sentiment around the company has been positive lately. Someone with an optimistic perspective could view the recent improvement in TSR as indicating that the business itself is getting better with time. It is all well and good that insiders have been buying shares, but we suggest you check here to see what price insiders were buying at.
Emera is not the only stock insiders are buying. So take a peek at this free list of growing companies with insider buying.
Please note, the market returns quoted in this article reflect the market weighted average returns of stocks that currently trade on CA exchanges.
We aim to bring you long-term focused research analysis driven by fundamental data. Note that our analysis may not factor in the latest price-sensitive company announcements or qualitative material.
If you spot an error that warrants correction, please contact the editor at editorial-team@simplywallst.com. This article by Simply Wall St is general in nature. It does not constitute a recommendation to buy or sell any stock, and does not take account of your objectives, or your financial situation. Simply Wall St has no position in the stocks mentioned. Thank you for reading.
