
 Yahoo Finance
 Investors Aren't Entirely Convinced About Obsidian Energy Ltd.'s (TSE:OBE) Earnings
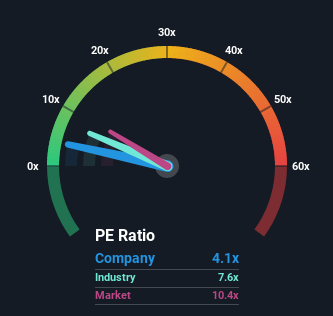
Obsidian Energy Ltd.'s (TSE:OBE) price-to-earnings (or "P/E") ratio of 4.1x might make it look like a strong buy right now compared to the market in Canada, where around half of the companies have P/E ratios above 11x and even P/E's above 24x are quite common. However, the P/E might be quite low for a reason and it requires further investigation to determine if it's justified.
Obsidian Energy could be doing better as its earnings have been going backwards lately while most other companies have been seeing positive earnings growth. It seems that many are expecting the dour earnings performance to persist, which has repressed the P/E. If you still like the company, you'd be hoping this isn't the case so that you could potentially pick up some stock while it's out of favour.
View our latest analysis for Obsidian Energy
Keen to find out how analysts think Obsidian Energy's future stacks up against the industry? In that case, our free report is a great place to start.
Does Growth Match The Low P/E?
Obsidian Energy's P/E ratio would be typical for a company that's expected to deliver very poor growth or even falling earnings, and importantly, perform much worse than the market.
If we review the last year of earnings, dishearteningly the company's profits fell to the tune of 44%. Unfortunately, that's brought it right back to where it started three years ago with EPS growth being virtually non-existent overall during that time. Accordingly, shareholders probably wouldn't have been overly satisfied with the unstable medium-term growth rates.
Looking ahead now, EPS is anticipated to climb by 15% per year during the coming three years according to the two analysts following the company. That's shaping up to be materially higher than the 8.8% each year growth forecast for the broader market.
In light of this, it's peculiar that Obsidian Energy's P/E sits below the majority of other companies. Apparently some shareholders are doubtful of the forecasts and have been accepting significantly lower selling prices.
The Bottom Line On Obsidian Energy's P/E
Using the price-to-earnings ratio alone to determine if you should sell your stock isn't sensible, however it can be a practical guide to the company's future prospects.
We've established that Obsidian Energy currently trades on a much lower than expected P/E since its forecast growth is higher than the wider market. When we see a strong earnings outlook with faster-than-market growth, we assume potential risks are what might be placing significant pressure on the P/E ratio. It appears many are indeed anticipating earnings instability, because these conditions should normally provide a boost to the share price.
Plus, you should also learn about these 3 warning signs we've spotted with Obsidian Energy (including 1 which is a bit unpleasant).
Of course, you might also be able to find a better stock than Obsidian Energy. So you may wish to see this free collection of other companies that sit on P/E's below 20x and have grown earnings strongly.
Have feedback on this article? Concerned about the content? Get in touch with us directly. Alternatively, email editorial-team (at) simplywallst.com.
This article by Simply Wall St is general in nature. We provide commentary based on historical data and analyst forecasts only using an unbiased methodology and our articles are not intended to be financial advice. It does not constitute a recommendation to buy or sell any stock, and does not take account of your objectives, or your financial situation. We aim to bring you long-term focused analysis driven by fundamental data. Note that our analysis may not factor in the latest price-sensitive company announcements or qualitative material. Simply Wall St has no position in any stocks mentioned.
Join A Paid User Research Session
You’ll receive a US$30 Amazon Gift card for 1 hour of your time while helping us build better investing tools for the individual investors like yourself. Sign up here