
 Yahoo Finance
 Investors Aren't Buying TransAlta Corporation's (TSE:TA) Revenues
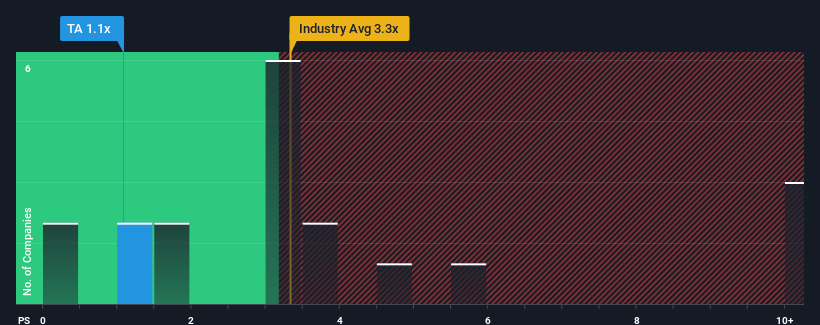
When close to half the companies in the Renewable Energy industry in Canada have price-to-sales ratios (or "P/S") above 3.3x, you may consider TransAlta Corporation (TSE:TA) as a highly attractive investment with its 1.1x P/S ratio. Nonetheless, we'd need to dig a little deeper to determine if there is a rational basis for the highly reduced P/S.
See our latest analysis for TransAlta
How Has TransAlta Performed Recently?
TransAlta could be doing better as it's been growing revenue less than most other companies lately. It seems that many are expecting the uninspiring revenue performance to persist, which has repressed the growth of the P/S ratio. If you still like the company, you'd be hoping revenue doesn't get any worse and that you could pick up some stock while it's out of favour.
Want the full picture on analyst estimates for the company? Then our free report on TransAlta will help you uncover what's on the horizon.
How Is TransAlta's Revenue Growth Trending?
There's an inherent assumption that a company should far underperform the industry for P/S ratios like TransAlta's to be considered reasonable.
If we review the last year of revenue growth, the company posted a worthy increase of 9.4%. The solid recent performance means it was also able to grow revenue by 27% in total over the last three years. Therefore, it's fair to say the revenue growth recently has been respectable for the company.
Turning to the outlook, the next three years should bring diminished returns, with revenue decreasing 11% per annum as estimated by the six analysts watching the company. With the industry predicted to deliver 4.5% growth per year, that's a disappointing outcome.
In light of this, it's understandable that TransAlta's P/S would sit below the majority of other companies. However, shrinking revenues are unlikely to lead to a stable P/S over the longer term. There's potential for the P/S to fall to even lower levels if the company doesn't improve its top-line growth.
What We Can Learn From TransAlta's P/S?
Using the price-to-sales ratio alone to determine if you should sell your stock isn't sensible, however it can be a practical guide to the company's future prospects.
With revenue forecasts that are inferior to the rest of the industry, it's no surprise that TransAlta's P/S is on the lower end of the spectrum. Right now shareholders are accepting the low P/S as they concede future revenue probably won't provide any pleasant surprises. Unless these conditions improve, they will continue to form a barrier for the share price around these levels.
Before you settle on your opinion, we've discovered 3 warning signs for TransAlta (1 is a bit concerning!) that you should be aware of.
If you're unsure about the strength of TransAlta's business, why not explore our interactive list of stocks with solid business fundamentals for some other companies you may have missed.
Have feedback on this article? Concerned about the content? Get in touch with us directly. Alternatively, email editorial-team (at) simplywallst.com.
This article by Simply Wall St is general in nature. We provide commentary based on historical data and analyst forecasts only using an unbiased methodology and our articles are not intended to be financial advice. It does not constitute a recommendation to buy or sell any stock, and does not take account of your objectives, or your financial situation. We aim to bring you long-term focused analysis driven by fundamental data. Note that our analysis may not factor in the latest price-sensitive company announcements or qualitative material. Simply Wall St has no position in any stocks mentioned.
Join A Paid User Research Session
You’ll receive a US$30 Amazon Gift card for 1 hour of your time while helping us build better investing tools for the individual investors like yourself. Sign up here
