
 Yahoo Finance
 Investors in American Airlines Group (NASDAQ:AAL) have unfortunately lost 66% over the last five years
Statistically speaking, long term investing is a profitable endeavour. But that doesn't mean long term investors can avoid big losses. For example the American Airlines Group Inc. (NASDAQ:AAL) share price dropped 66% over five years. That's an unpleasant experience for long term holders. And some of the more recent buyers are probably worried, too, with the stock falling 40% in the last year. Furthermore, it's down 18% in about a quarter. That's not much fun for holders.
Since shareholders are down over the longer term, lets look at the underlying fundamentals over the that time and see if they've been consistent with returns.
See our latest analysis for American Airlines Group
While the efficient markets hypothesis continues to be taught by some, it has been proven that markets are over-reactive dynamic systems, and investors are not always rational. By comparing earnings per share (EPS) and share price changes over time, we can get a feel for how investor attitudes to a company have morphed over time.
American Airlines Group became profitable within the last five years. That would generally be considered a positive, so we are surprised to see the share price is down. Other metrics may better explain the share price move.
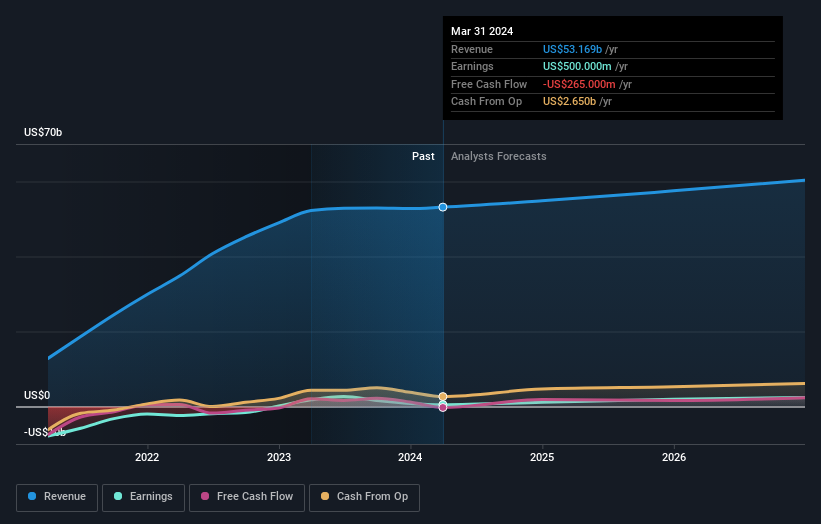
In contrast to the share price, revenue has actually increased by 8.0% a year in the five year period. So it seems one might have to take closer look at the fundamentals to understand why the share price languishes. After all, there may be an opportunity.
The image below shows how earnings and revenue have tracked over time (if you click on the image you can see greater detail).
American Airlines Group is well known by investors, and plenty of clever analysts have tried to predict the future profit levels. If you are thinking of buying or selling American Airlines Group stock, you should check out this free report showing analyst consensus estimates for future profits.
A Different Perspective
Investors in American Airlines Group had a tough year, with a total loss of 40%, against a market gain of about 25%. Even the share prices of good stocks drop sometimes, but we want to see improvements in the fundamental metrics of a business, before getting too interested. Regrettably, last year's performance caps off a bad run, with the shareholders facing a total loss of 11% per year over five years. Generally speaking long term share price weakness can be a bad sign, though contrarian investors might want to research the stock in hope of a turnaround. I find it very interesting to look at share price over the long term as a proxy for business performance. But to truly gain insight, we need to consider other information, too. Case in point: We've spotted 4 warning signs for American Airlines Group you should be aware of, and 2 of them are significant.
For those who like to find winning investments this free list of undervalued companies with recent insider purchasing, could be just the ticket.
Please note, the market returns quoted in this article reflect the market weighted average returns of stocks that currently trade on American exchanges.
Have feedback on this article? Concerned about the content? Get in touch with us directly. Alternatively, email editorial-team (at) simplywallst.com.
This article by Simply Wall St is general in nature. We provide commentary based on historical data and analyst forecasts only using an unbiased methodology and our articles are not intended to be financial advice. It does not constitute a recommendation to buy or sell any stock, and does not take account of your objectives, or your financial situation. We aim to bring you long-term focused analysis driven by fundamental data. Note that our analysis may not factor in the latest price-sensitive company announcements or qualitative material. Simply Wall St has no position in any stocks mentioned.
Have feedback on this article? Concerned about the content? Get in touch with us directly. Alternatively, email editorial-team@simplywallst.com
