
 Yahoo Finance
 Investing in TransAlta Renewables (TSE:RNW) three years ago would have delivered you a 103% gain
By buying an index fund, you can roughly match the market return with ease. But if you pick the right individual stocks, you could make more than that. For example, the TransAlta Renewables Inc. (TSE:RNW) share price is up 69% in the last three years, clearly besting the market return of around 23% (not including dividends). On the other hand, the returns haven't been quite so good recently, with shareholders up just 33% , including dividends .
Now it's worth having a look at the company's fundamentals too, because that will help us determine if the long term shareholder return has matched the performance of the underlying business.
Check out our latest analysis for TransAlta Renewables
To paraphrase Benjamin Graham: Over the short term the market is a voting machine, but over the long term it's a weighing machine. One imperfect but simple way to consider how the market perception of a company has shifted is to compare the change in the earnings per share (EPS) with the share price movement.
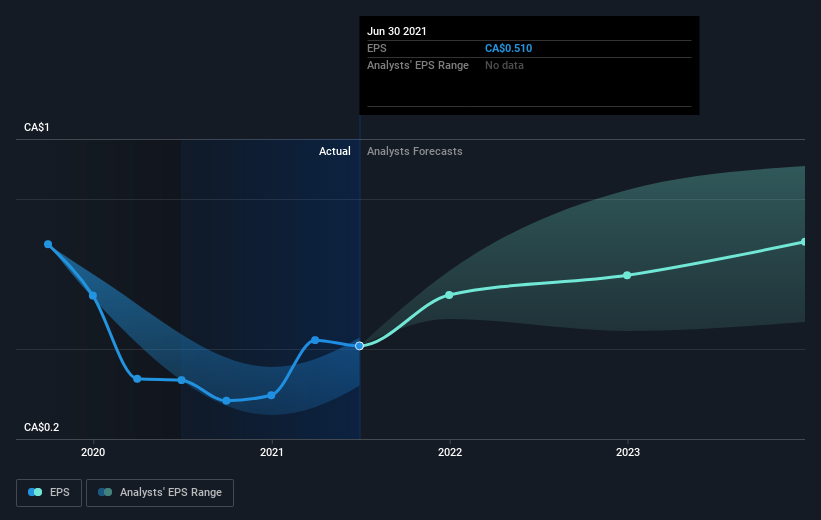
During three years of share price growth, TransAlta Renewables achieved compound earnings per share growth of 12% per year. This EPS growth is lower than the 19% average annual increase in the share price. This indicates that the market is feeling more optimistic on the stock, after the last few years of progress. It's not unusual to see the market 're-rate' a stock, after a few years of growth.
The company's earnings per share (over time) is depicted in the image below (click to see the exact numbers).
We know that TransAlta Renewables has improved its bottom line lately, but is it going to grow revenue? Check if analysts think TransAlta Renewables will grow revenue in the future.
What About Dividends?
It is important to consider the total shareholder return, as well as the share price return, for any given stock. Whereas the share price return only reflects the change in the share price, the TSR includes the value of dividends (assuming they were reinvested) and the benefit of any discounted capital raising or spin-off. So for companies that pay a generous dividend, the TSR is often a lot higher than the share price return. As it happens, TransAlta Renewables' TSR for the last 3 years was 103%, which exceeds the share price return mentioned earlier. This is largely a result of its dividend payments!
A Different Perspective
TransAlta Renewables provided a TSR of 33% over the year (including dividends). That's fairly close to the broader market return. Most would be happy with a gain, and it helps that the year's return is actually better than the average return over five years, which was 14%. It is possible that management foresight will bring growth well into the future, even if the share price slows down. While it is well worth considering the different impacts that market conditions can have on the share price, there are other factors that are even more important. Take risks, for example - TransAlta Renewables has 1 warning sign we think you should be aware of.
If you like to buy stocks alongside management, then you might just love this free list of companies. (Hint: insiders have been buying them).
Please note, the market returns quoted in this article reflect the market weighted average returns of stocks that currently trade on CA exchanges.
This article by Simply Wall St is general in nature. We provide commentary based on historical data and analyst forecasts only using an unbiased methodology and our articles are not intended to be financial advice. It does not constitute a recommendation to buy or sell any stock, and does not take account of your objectives, or your financial situation. We aim to bring you long-term focused analysis driven by fundamental data. Note that our analysis may not factor in the latest price-sensitive company announcements or qualitative material. Simply Wall St has no position in any stocks mentioned.
Have feedback on this article? Concerned about the content? Get in touch with us directly. Alternatively, email editorial-team (at) simplywallst.com.
