
 Yahoo Finance
 Investing in Tradeweb Markets (NASDAQ:TW) three years ago would have delivered you a 95% gain
By buying an index fund, you can roughly match the market return with ease. But if you buy good businesses at attractive prices, your portfolio returns could exceed the average market return. For example, Tradeweb Markets Inc. (NASDAQ:TW) shareholders have seen the share price rise 92% over three years, well in excess of the market return (62%, not including dividends).
Now it's worth having a look at the company's fundamentals too, because that will help us determine if the long term shareholder return has matched the performance of the underlying business.
View our latest analysis for Tradeweb Markets
While the efficient markets hypothesis continues to be taught by some, it has been proven that markets are over-reactive dynamic systems, and investors are not always rational. One imperfect but simple way to consider how the market perception of a company has shifted is to compare the change in the earnings per share (EPS) with the share price movement.
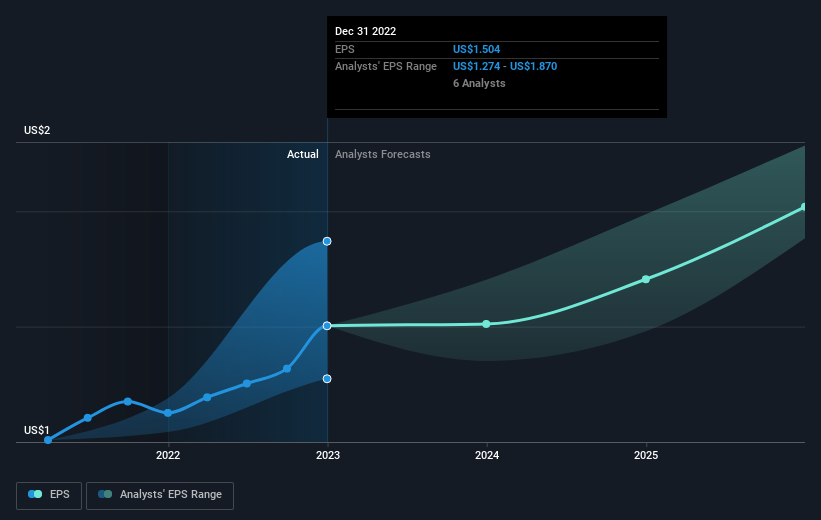
Tradeweb Markets was able to grow its EPS at 38% per year over three years, sending the share price higher. The average annual share price increase of 24% is actually lower than the EPS growth. So one could reasonably conclude that the market has cooled on the stock.
You can see below how EPS has changed over time (discover the exact values by clicking on the image).
We know that Tradeweb Markets has improved its bottom line over the last three years, but what does the future have in store? Take a more thorough look at Tradeweb Markets' financial health with this free report on its balance sheet.
What About Dividends?
As well as measuring the share price return, investors should also consider the total shareholder return (TSR). The TSR incorporates the value of any spin-offs or discounted capital raisings, along with any dividends, based on the assumption that the dividends are reinvested. Arguably, the TSR gives a more comprehensive picture of the return generated by a stock. We note that for Tradeweb Markets the TSR over the last 3 years was 95%, which is better than the share price return mentioned above. This is largely a result of its dividend payments!
A Different Perspective
The last twelve months weren't great for Tradeweb Markets shares, which performed worse than the market, costing holders 20%, including dividends. The market shed around 10%, no doubt weighing on the stock price. Fortunately the longer term story is brighter, with total returns averaging about 25% per year over three years. The recent sell-off could be an opportunity if the business remains sound, so it may be worth checking the fundamental data for signs of a long-term growth trend. Is Tradeweb Markets cheap compared to other companies? These 3 valuation measures might help you decide.
But note: Tradeweb Markets may not be the best stock to buy. So take a peek at this free list of interesting companies with past earnings growth (and further growth forecast).
Please note, the market returns quoted in this article reflect the market weighted average returns of stocks that currently trade on American exchanges.
Have feedback on this article? Concerned about the content? Get in touch with us directly. Alternatively, email editorial-team (at) simplywallst.com.
This article by Simply Wall St is general in nature. We provide commentary based on historical data and analyst forecasts only using an unbiased methodology and our articles are not intended to be financial advice. It does not constitute a recommendation to buy or sell any stock, and does not take account of your objectives, or your financial situation. We aim to bring you long-term focused analysis driven by fundamental data. Note that our analysis may not factor in the latest price-sensitive company announcements or qualitative material. Simply Wall St has no position in any stocks mentioned.
Join A Paid User Research Session
You’ll receive a US$30 Amazon Gift card for 1 hour of your time while helping us build better investing tools for the individual investors like yourself. Sign up here
