
 Yahoo Finance
 Investing in Thermo Fisher Scientific (NYSE:TMO) five years ago would have delivered you a 193% gain
Thermo Fisher Scientific Inc. (NYSE:TMO) shareholders might be concerned after seeing the share price drop 15% in the last quarter. But that scarcely detracts from the really solid long term returns generated by the company over five years. In fact, the share price is 189% higher today. To some, the recent pullback wouldn't be surprising after such a fast rise. Only time will tell if there is still too much optimism currently reflected in the share price.
Let's take a look at the underlying fundamentals over the longer term, and see if they've been consistent with shareholders returns.
See our latest analysis for Thermo Fisher Scientific
While markets are a powerful pricing mechanism, share prices reflect investor sentiment, not just underlying business performance. One flawed but reasonable way to assess how sentiment around a company has changed is to compare the earnings per share (EPS) with the share price.
Over half a decade, Thermo Fisher Scientific managed to grow its earnings per share at 29% a year. The EPS growth is more impressive than the yearly share price gain of 24% over the same period. Therefore, it seems the market has become relatively pessimistic about the company.
The graphic below depicts how EPS has changed over time (unveil the exact values by clicking on the image).
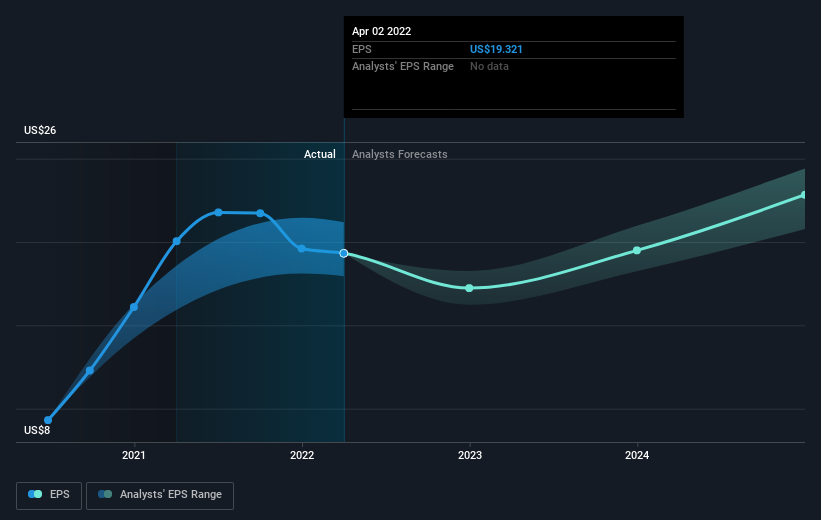
We know that Thermo Fisher Scientific has improved its bottom line over the last three years, but what does the future have in store? If you are thinking of buying or selling Thermo Fisher Scientific stock, you should check out this FREE detailed report on its balance sheet.
What About Dividends?
When looking at investment returns, it is important to consider the difference between total shareholder return (TSR) and share price return. The TSR incorporates the value of any spin-offs or discounted capital raisings, along with any dividends, based on the assumption that the dividends are reinvested. It's fair to say that the TSR gives a more complete picture for stocks that pay a dividend. We note that for Thermo Fisher Scientific the TSR over the last 5 years was 193%, which is better than the share price return mentioned above. This is largely a result of its dividend payments!
A Different Perspective
We're pleased to report that Thermo Fisher Scientific shareholders have received a total shareholder return of 3.8% over one year. That's including the dividend. Having said that, the five-year TSR of 24% a year, is even better. Potential buyers might understandably feel they've missed the opportunity, but it's always possible business is still firing on all cylinders. While it is well worth considering the different impacts that market conditions can have on the share price, there are other factors that are even more important. For instance, we've identified 2 warning signs for Thermo Fisher Scientific that you should be aware of.
Of course, you might find a fantastic investment by looking elsewhere. So take a peek at this free list of companies we expect will grow earnings.
Please note, the market returns quoted in this article reflect the market weighted average returns of stocks that currently trade on US exchanges.
Have feedback on this article? Concerned about the content? Get in touch with us directly. Alternatively, email editorial-team (at) simplywallst.com.
This article by Simply Wall St is general in nature. We provide commentary based on historical data and analyst forecasts only using an unbiased methodology and our articles are not intended to be financial advice. It does not constitute a recommendation to buy or sell any stock, and does not take account of your objectives, or your financial situation. We aim to bring you long-term focused analysis driven by fundamental data. Note that our analysis may not factor in the latest price-sensitive company announcements or qualitative material. Simply Wall St has no position in any stocks mentioned.
