
 Yahoo Finance
 Investing in Sylogist (TSE:SYZ) a year ago would have delivered you a 43% gain
If you want to compound wealth in the stock market, you can do so by buying an index fund. But one can do better than that by picking better than average stocks (as part of a diversified portfolio). For example, the Sylogist Ltd. (TSE:SYZ) share price is up 42% in the last 1 year, clearly besting the market return of around 11% (not including dividends). That's a solid performance by our standards! In contrast, the longer term returns are negative, since the share price is 31% lower than it was three years ago.
So let's assess the underlying fundamentals over the last 1 year and see if they've moved in lock-step with shareholder returns.
See our latest analysis for Sylogist
To paraphrase Benjamin Graham: Over the short term the market is a voting machine, but over the long term it's a weighing machine. One imperfect but simple way to consider how the market perception of a company has shifted is to compare the change in the earnings per share (EPS) with the share price movement.
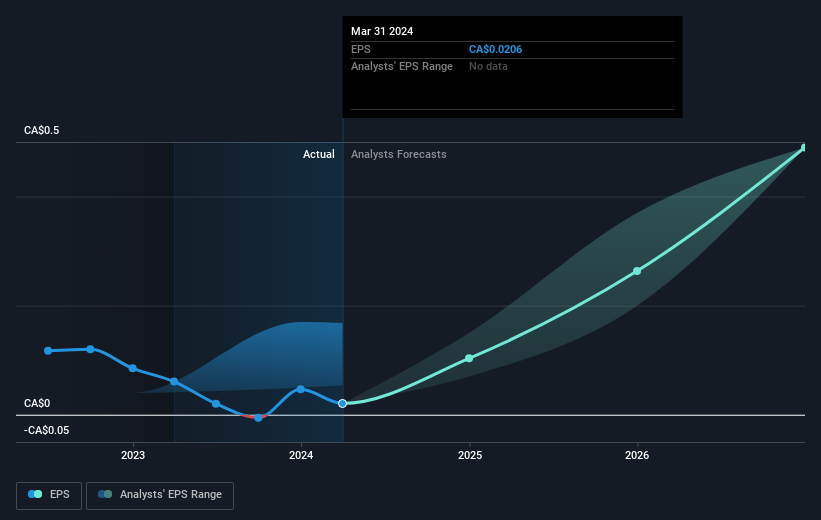
During the last year Sylogist grew its earnings per share, moving from a loss to a profit.
The company was close to break-even last year, so earnings per share of CA$0.021 isn't particularly stand out. We'd argue the positive share price reflects the move to profitability. Some investors scan for companies that have just become profitable, since that's an important business development milestone.
You can see below how EPS has changed over time (discover the exact values by clicking on the image).
We consider it positive that insiders have made significant purchases in the last year. Having said that, most people consider earnings and revenue growth trends to be a more meaningful guide to the business. It might be well worthwhile taking a look at our free report on Sylogist's earnings, revenue and cash flow.
A Different Perspective
We're pleased to report that Sylogist shareholders have received a total shareholder return of 43% over one year. Of course, that includes the dividend. Since the one-year TSR is better than the five-year TSR (the latter coming in at 0.3% per year), it would seem that the stock's performance has improved in recent times. In the best case scenario, this may hint at some real business momentum, implying that now could be a great time to delve deeper. I find it very interesting to look at share price over the long term as a proxy for business performance. But to truly gain insight, we need to consider other information, too. Case in point: We've spotted 2 warning signs for Sylogist you should be aware of.
Sylogist is not the only stock that insiders are buying. For those who like to find lesser know companies this free list of growing companies with recent insider purchasing, could be just the ticket.
Please note, the market returns quoted in this article reflect the market weighted average returns of stocks that currently trade on Canadian exchanges.
Have feedback on this article? Concerned about the content? Get in touch with us directly. Alternatively, email editorial-team (at) simplywallst.com.
This article by Simply Wall St is general in nature. We provide commentary based on historical data and analyst forecasts only using an unbiased methodology and our articles are not intended to be financial advice. It does not constitute a recommendation to buy or sell any stock, and does not take account of your objectives, or your financial situation. We aim to bring you long-term focused analysis driven by fundamental data. Note that our analysis may not factor in the latest price-sensitive company announcements or qualitative material. Simply Wall St has no position in any stocks mentioned.
