
 Yahoo Finance
 Investing in Summit Materials (NYSE:SUM) five years ago would have delivered you a 195% gain
When you buy shares in a company, it's worth keeping in mind the possibility that it could fail, and you could lose your money. But on the bright side, you can make far more than 100% on a really good stock. One great example is Summit Materials, Inc. (NYSE:SUM) which saw its share price drive 195% higher over five years. It's also good to see the share price up 16% over the last quarter. But this move may well have been assisted by the reasonably buoyant market (up 9.4% in 90 days).
Let's take a look at the underlying fundamentals over the longer term, and see if they've been consistent with shareholders returns.
Check out our latest analysis for Summit Materials
While markets are a powerful pricing mechanism, share prices reflect investor sentiment, not just underlying business performance. One imperfect but simple way to consider how the market perception of a company has shifted is to compare the change in the earnings per share (EPS) with the share price movement.
During five years of share price growth, Summit Materials achieved compound earnings per share (EPS) growth of 41% per year. The EPS growth is more impressive than the yearly share price gain of 24% over the same period. Therefore, it seems the market has become relatively pessimistic about the company.
The company's earnings per share (over time) is depicted in the image below (click to see the exact numbers).
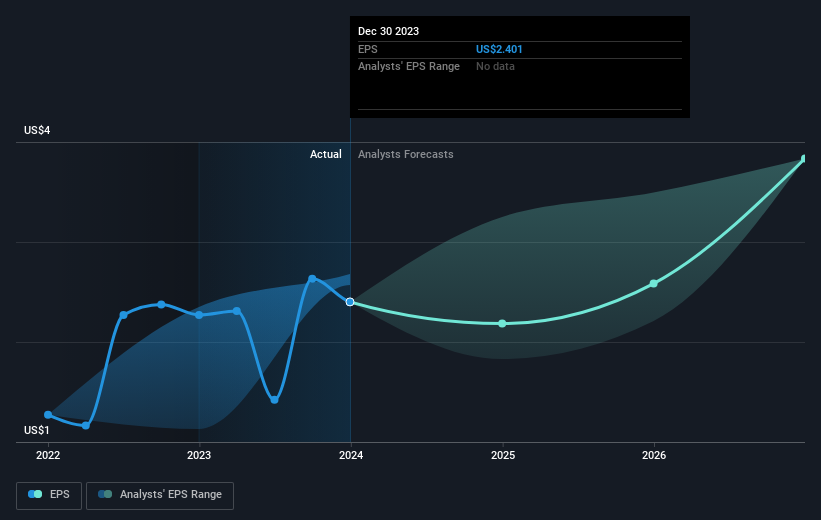
This free interactive report on Summit Materials' earnings, revenue and cash flow is a great place to start, if you want to investigate the stock further.
A Different Perspective
We're pleased to report that Summit Materials shareholders have received a total shareholder return of 56% over one year. Since the one-year TSR is better than the five-year TSR (the latter coming in at 24% per year), it would seem that the stock's performance has improved in recent times. In the best case scenario, this may hint at some real business momentum, implying that now could be a great time to delve deeper. It's always interesting to track share price performance over the longer term. But to understand Summit Materials better, we need to consider many other factors. To that end, you should learn about the 3 warning signs we've spotted with Summit Materials (including 1 which is concerning) .
We will like Summit Materials better if we see some big insider buys. While we wait, check out this free list of growing companies with considerable, recent, insider buying.
Please note, the market returns quoted in this article reflect the market weighted average returns of stocks that currently trade on American exchanges.
Have feedback on this article? Concerned about the content? Get in touch with us directly. Alternatively, email editorial-team (at) simplywallst.com.
This article by Simply Wall St is general in nature. We provide commentary based on historical data and analyst forecasts only using an unbiased methodology and our articles are not intended to be financial advice. It does not constitute a recommendation to buy or sell any stock, and does not take account of your objectives, or your financial situation. We aim to bring you long-term focused analysis driven by fundamental data. Note that our analysis may not factor in the latest price-sensitive company announcements or qualitative material. Simply Wall St has no position in any stocks mentioned.
