
 Yahoo Finance
 Investing in ScanSource (NASDAQ:SCSC) a year ago would have delivered you a 48% gain
The simplest way to invest in stocks is to buy exchange traded funds. But one can do better than that by picking better than average stocks (as part of a diversified portfolio). For example, the ScanSource, Inc. (NASDAQ:SCSC) share price is up 48% in the last 1 year, clearly besting the market return of around 28% (not including dividends). If it can keep that out-performance up over the long term, investors will do very well! Looking back further, the stock price is 44% higher than it was three years ago.
With that in mind, it's worth seeing if the company's underlying fundamentals have been the driver of long term performance, or if there are some discrepancies.
Check out our latest analysis for ScanSource
To paraphrase Benjamin Graham: Over the short term the market is a voting machine, but over the long term it's a weighing machine. One imperfect but simple way to consider how the market perception of a company has shifted is to compare the change in the earnings per share (EPS) with the share price movement.
Over the last twelve months, ScanSource actually shrank its EPS by 6.0%.
This means it's unlikely the market is judging the company based on earnings growth. Therefore, it seems likely that investors are putting more weight on metrics other than EPS, at the moment.
Unfortunately ScanSource's fell 4.5% over twelve months. So using a snapshot of key business metrics doesn't give us a good picture of why the market is bidding up the stock.
The company's revenue and earnings (over time) are depicted in the image below (click to see the exact numbers).
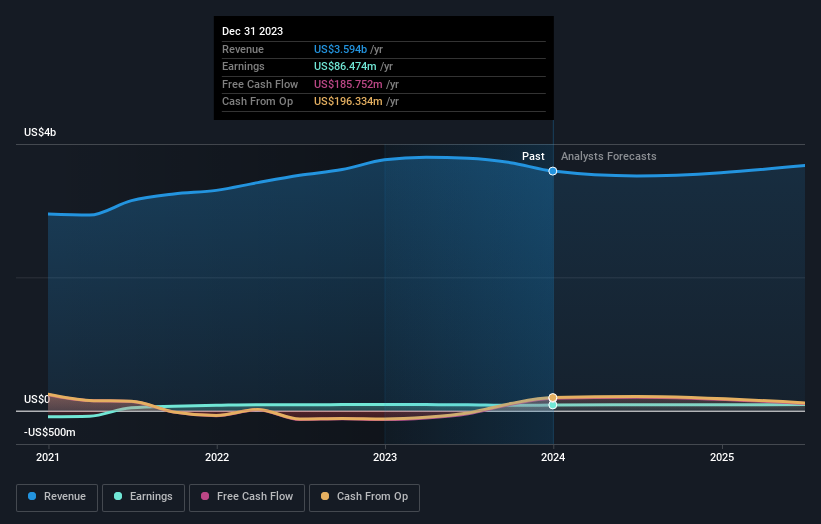
It is of course excellent to see how ScanSource has grown profits over the years, but the future is more important for shareholders. This free interactive report on ScanSource's balance sheet strength is a great place to start, if you want to investigate the stock further.
A Different Perspective
We're pleased to report that ScanSource shareholders have received a total shareholder return of 48% over one year. That gain is better than the annual TSR over five years, which is 3%. Therefore it seems like sentiment around the company has been positive lately. Someone with an optimistic perspective could view the recent improvement in TSR as indicating that the business itself is getting better with time. It's always interesting to track share price performance over the longer term. But to understand ScanSource better, we need to consider many other factors. For example, we've discovered 1 warning sign for ScanSource that you should be aware of before investing here.
If you like to buy stocks alongside management, then you might just love this free list of companies. (Hint: insiders have been buying them).
Please note, the market returns quoted in this article reflect the market weighted average returns of stocks that currently trade on American exchanges.
Have feedback on this article? Concerned about the content? Get in touch with us directly. Alternatively, email editorial-team (at) simplywallst.com.
This article by Simply Wall St is general in nature. We provide commentary based on historical data and analyst forecasts only using an unbiased methodology and our articles are not intended to be financial advice. It does not constitute a recommendation to buy or sell any stock, and does not take account of your objectives, or your financial situation. We aim to bring you long-term focused analysis driven by fundamental data. Note that our analysis may not factor in the latest price-sensitive company announcements or qualitative material. Simply Wall St has no position in any stocks mentioned.
