
 Yahoo Finance
 Investing in NEXTDC (ASX:NXT) five years ago would have delivered you a 174% gain
The worst result, after buying shares in a company (assuming no leverage), would be if you lose all the money you put in. But on the bright side, you can make far more than 100% on a really good stock. One great example is NEXTDC Limited (ASX:NXT) which saw its share price drive 174% higher over five years. In more good news, the share price has risen 14% in thirty days.
So let's investigate and see if the longer term performance of the company has been in line with the underlying business' progress.
See our latest analysis for NEXTDC
We don't think that NEXTDC's modest trailing twelve month profit has the market's full attention at the moment. We think revenue is probably a better guide. Generally speaking, we'd consider a stock like this alongside loss-making companies, simply because the quantum of the profit is so low. For shareholders to have confidence a company will grow profits significantly, it must grow revenue.
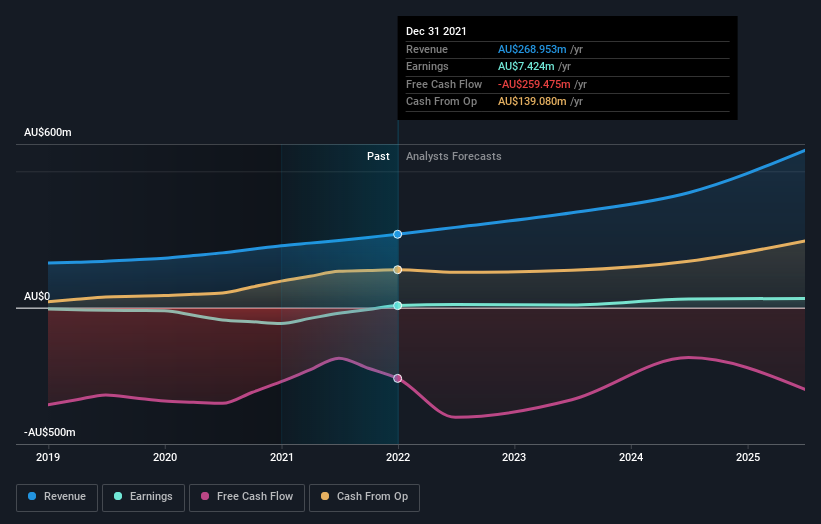
In the last 5 years NEXTDC saw its revenue grow at 18% per year. Even measured against other revenue-focussed companies, that's a good result. So it's not entirely surprising that the share price reflected this performance by increasing at a rate of 22% per year, in that time. So it seems likely that buyers have paid attention to the strong revenue growth. NEXTDC seems like a high growth stock - so growth investors might want to add it to their watchlist.
You can see how earnings and revenue have changed over time in the image below (click on the chart to see the exact values).
NEXTDC is a well known stock, with plenty of analyst coverage, suggesting some visibility into future growth. You can see what analysts are predicting for NEXTDC in this interactive graph of future profit estimates.
A Different Perspective
We regret to report that NEXTDC shareholders are down 9.7% for the year. Unfortunately, that's worse than the broader market decline of 6.1%. Having said that, it's inevitable that some stocks will be oversold in a falling market. The key is to keep your eyes on the fundamental developments. Longer term investors wouldn't be so upset, since they would have made 22%, each year, over five years. It could be that the recent sell-off is an opportunity, so it may be worth checking the fundamental data for signs of a long term growth trend. It's always interesting to track share price performance over the longer term. But to understand NEXTDC better, we need to consider many other factors. To that end, you should be aware of the 2 warning signs we've spotted with NEXTDC .
If you are like me, then you will not want to miss this free list of growing companies that insiders are buying.
Please note, the market returns quoted in this article reflect the market weighted average returns of stocks that currently trade on AU exchanges.
Have feedback on this article? Concerned about the content? Get in touch with us directly. Alternatively, email editorial-team (at) simplywallst.com.
This article by Simply Wall St is general in nature. We provide commentary based on historical data and analyst forecasts only using an unbiased methodology and our articles are not intended to be financial advice. It does not constitute a recommendation to buy or sell any stock, and does not take account of your objectives, or your financial situation. We aim to bring you long-term focused analysis driven by fundamental data. Note that our analysis may not factor in the latest price-sensitive company announcements or qualitative material. Simply Wall St has no position in any stocks mentioned.
Join A Paid User Research Session
You’ll receive a US$30 Amazon Gift card for 1 hour of your time while helping us build better investing tools for the individual investors like yourself. Sign up here
