
 Yahoo Finance
 Investing in MarineMax (NYSE:HZO) five years ago would have delivered you a 61% gain
While MarineMax, Inc. (NYSE:HZO) shareholders are probably generally happy, the stock hasn't had particularly good run recently, with the share price falling 18% in the last quarter. But the silver lining is the stock is up over five years. In that time, it is up 61%, which isn't bad, but is below the market return of 80%. Unfortunately not all shareholders will have held it for five years, so spare a thought for those caught in the 51% decline over the last three years: that's a long time to wait for profits.
Let's take a look at the underlying fundamentals over the longer term, and see if they've been consistent with shareholders returns.
View our latest analysis for MarineMax
To paraphrase Benjamin Graham: Over the short term the market is a voting machine, but over the long term it's a weighing machine. By comparing earnings per share (EPS) and share price changes over time, we can get a feel for how investor attitudes to a company have morphed over time.
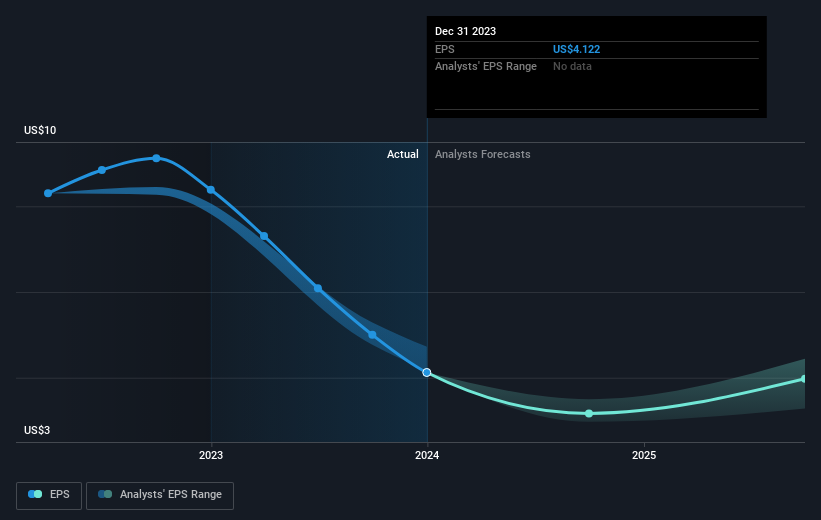
During five years of share price growth, MarineMax achieved compound earnings per share (EPS) growth of 18% per year. The EPS growth is more impressive than the yearly share price gain of 10% over the same period. So it seems the market isn't so enthusiastic about the stock these days. The reasonably low P/E ratio of 6.91 also suggests market apprehension.
You can see below how EPS has changed over time (discover the exact values by clicking on the image).
Dive deeper into MarineMax's key metrics by checking this interactive graph of MarineMax's earnings, revenue and cash flow.
A Different Perspective
MarineMax shareholders gained a total return of 1.9% during the year. But that return falls short of the market. It's probably a good sign that the company has an even better long term track record, having provided shareholders with an annual TSR of 10% over five years. Maybe the share price is just taking a breather while the business executes on its growth strategy. While it is well worth considering the different impacts that market conditions can have on the share price, there are other factors that are even more important. Case in point: We've spotted 4 warning signs for MarineMax you should be aware of, and 1 of them is significant.
If you like to buy stocks alongside management, then you might just love this free list of companies. (Hint: insiders have been buying them).
Please note, the market returns quoted in this article reflect the market weighted average returns of stocks that currently trade on American exchanges.
Have feedback on this article? Concerned about the content? Get in touch with us directly. Alternatively, email editorial-team (at) simplywallst.com.
This article by Simply Wall St is general in nature. We provide commentary based on historical data and analyst forecasts only using an unbiased methodology and our articles are not intended to be financial advice. It does not constitute a recommendation to buy or sell any stock, and does not take account of your objectives, or your financial situation. We aim to bring you long-term focused analysis driven by fundamental data. Note that our analysis may not factor in the latest price-sensitive company announcements or qualitative material. Simply Wall St has no position in any stocks mentioned.
