
 Yahoo Finance
 Investing in DWF Group (LON:DWF) a year ago would have delivered you a 30% gain
A diverse portfolio of stocks will always have winners and losers. But if you're going to beat the market overall, you need to have individual stocks that outperform. DWF Group plc (LON:DWF) has done well over the last year, with the stock price up 24% beating the market return of 24% (not including dividends). Note that businesses generally develop over the long term, so the returns over the last year might not reflect a long term trend.
Now it's worth having a look at the company's fundamentals too, because that will help us determine if the long term shareholder return has matched the performance of the underlying business.
View our latest analysis for DWF Group
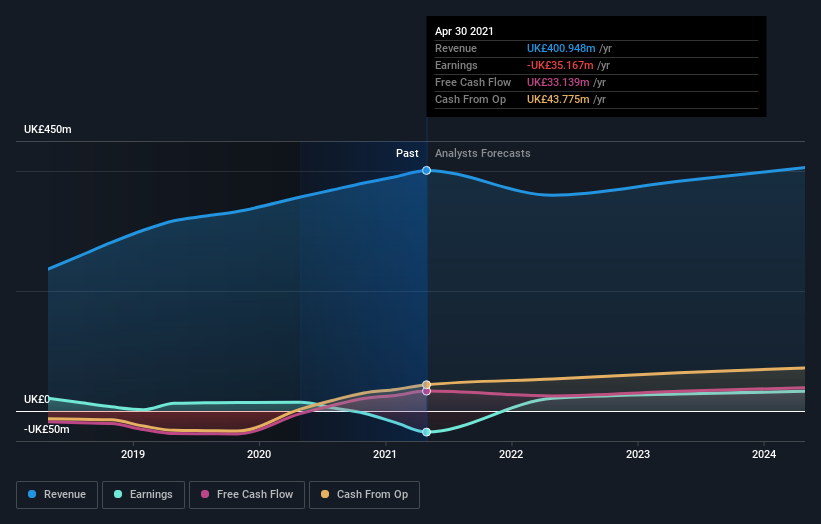
DWF Group isn't currently profitable, so most analysts would look to revenue growth to get an idea of how fast the underlying business is growing. Generally speaking, companies without profits are expected to grow revenue every year, and at a good clip. That's because it's hard to be confident a company will be sustainable if revenue growth is negligible, and it never makes a profit.
DWF Group grew its revenue by 12% last year. That's not great considering the company is losing money. In keeping with the revenue growth, the share price gained 24% in that time. That's not a standout result, but it is solid - much like the level of revenue growth. It could be worth keeping an eye on this one, especially if growth accelerates.
You can see how earnings and revenue have changed over time in the image below (click on the chart to see the exact values).
Take a more thorough look at DWF Group's financial health with this free report on its balance sheet.
What About Dividends?
As well as measuring the share price return, investors should also consider the total shareholder return (TSR). Whereas the share price return only reflects the change in the share price, the TSR includes the value of dividends (assuming they were reinvested) and the benefit of any discounted capital raising or spin-off. Arguably, the TSR gives a more comprehensive picture of the return generated by a stock. As it happens, DWF Group's TSR for the last 1 year was 30%, which exceeds the share price return mentioned earlier. This is largely a result of its dividend payments!
A Different Perspective
In the last year the market returned about 29%, and DWF Group generated a TSR of 30% for its shareholders. However, the share price has actually dropped 2.5% over the last three months. It may simply be that the share price got ahead of itself, although you might want to check for any weak results. I find it very interesting to look at share price over the long term as a proxy for business performance. But to truly gain insight, we need to consider other information, too. Consider for instance, the ever-present spectre of investment risk. We've identified 2 warning signs with DWF Group (at least 1 which can't be ignored) , and understanding them should be part of your investment process.
Of course DWF Group may not be the best stock to buy. So you may wish to see this free collection of growth stocks.
Please note, the market returns quoted in this article reflect the market weighted average returns of stocks that currently trade on GB exchanges.
This article by Simply Wall St is general in nature. We provide commentary based on historical data and analyst forecasts only using an unbiased methodology and our articles are not intended to be financial advice. It does not constitute a recommendation to buy or sell any stock, and does not take account of your objectives, or your financial situation. We aim to bring you long-term focused analysis driven by fundamental data. Note that our analysis may not factor in the latest price-sensitive company announcements or qualitative material. Simply Wall St has no position in any stocks mentioned.
Have feedback on this article? Concerned about the content? Get in touch with us directly. Alternatively, email editorial-team (at) simplywallst.com.
