
 Yahoo Finance
 Investing in CURO Group Holdings (NYSE:CURO) three years ago would have delivered you a 70% gain
While CURO Group Holdings Corp. (NYSE:CURO) shareholders are probably generally happy, the stock hasn't had particularly good run recently, with the share price falling 11% in the last quarter. In contrast the stock is up over the last three years. In that time, it is up 62%, which isn't bad, but not amazing either.
So let's investigate and see if the longer term performance of the company has been in line with the underlying business' progress.
Check out our latest analysis for CURO Group Holdings
While the efficient markets hypothesis continues to be taught by some, it has been proven that markets are over-reactive dynamic systems, and investors are not always rational. One way to examine how market sentiment has changed over time is to look at the interaction between a company's share price and its earnings per share (EPS).
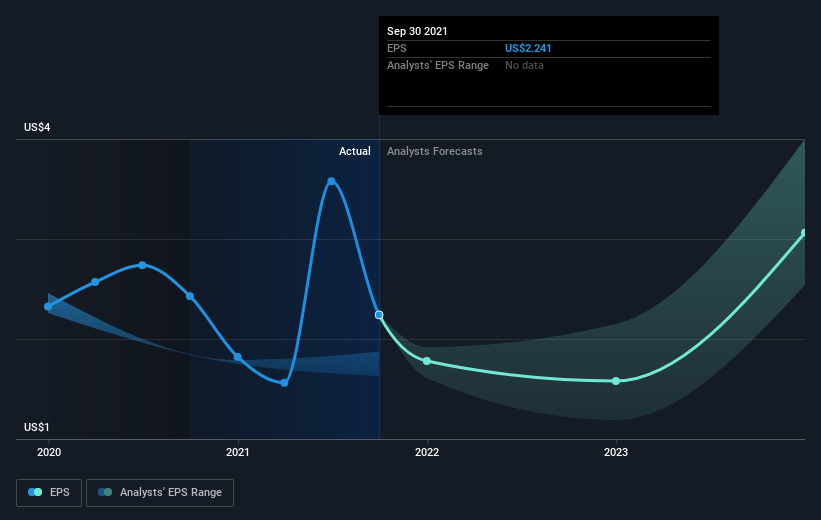
CURO Group Holdings was able to grow its EPS at 136% per year over three years, sending the share price higher. This EPS growth is higher than the 17% average annual increase in the share price. Therefore, it seems the market has moderated its expectations for growth, somewhat. This cautious sentiment is reflected in its (fairly low) P/E ratio of 7.32.
You can see below how EPS has changed over time (discover the exact values by clicking on the image).
We know that CURO Group Holdings has improved its bottom line over the last three years, but what does the future have in store? Take a more thorough look at CURO Group Holdings' financial health with this free report on its balance sheet.
What About Dividends?
As well as measuring the share price return, investors should also consider the total shareholder return (TSR). Whereas the share price return only reflects the change in the share price, the TSR includes the value of dividends (assuming they were reinvested) and the benefit of any discounted capital raising or spin-off. Arguably, the TSR gives a more comprehensive picture of the return generated by a stock. We note that for CURO Group Holdings the TSR over the last 3 years was 70%, which is better than the share price return mentioned above. And there's no prize for guessing that the dividend payments largely explain the divergence!
A Different Perspective
We're pleased to report that CURO Group Holdings rewarded shareholders with a total shareholder return of 27% over the last year. And yes, that does include the dividend. That gain actually surpasses the 19% TSR it generated (per year) over three years. These improved returns may hint at some real business momentum, implying that now could be a great time to delve deeper. I find it very interesting to look at share price over the long term as a proxy for business performance. But to truly gain insight, we need to consider other information, too. For instance, we've identified 4 warning signs for CURO Group Holdings (1 doesn't sit too well with us) that you should be aware of.
But note: CURO Group Holdings may not be the best stock to buy. So take a peek at this free list of interesting companies with past earnings growth (and further growth forecast).
Please note, the market returns quoted in this article reflect the market weighted average returns of stocks that currently trade on US exchanges.
Have feedback on this article? Concerned about the content? Get in touch with us directly. Alternatively, email editorial-team (at) simplywallst.com.
This article by Simply Wall St is general in nature. We provide commentary based on historical data and analyst forecasts only using an unbiased methodology and our articles are not intended to be financial advice. It does not constitute a recommendation to buy or sell any stock, and does not take account of your objectives, or your financial situation. We aim to bring you long-term focused analysis driven by fundamental data. Note that our analysis may not factor in the latest price-sensitive company announcements or qualitative material. Simply Wall St has no position in any stocks mentioned.
