
 Yahoo Finance
 Investing in Belvoir Group (LON:BLV) five years ago would have delivered you a 226% gain
The worst result, after buying shares in a company (assuming no leverage), would be if you lose all the money you put in. But when you pick a company that is really flourishing, you can make more than 100%. For instance, the price of Belvoir Group PLC (LON:BLV) stock is up an impressive 154% over the last five years. It's also good to see the share price up 13% over the last quarter.
So let's investigate and see if the longer term performance of the company has been in line with the underlying business' progress.
See our latest analysis for Belvoir Group
In his essay The Superinvestors of Graham-and-Doddsville Warren Buffett described how share prices do not always rationally reflect the value of a business. By comparing earnings per share (EPS) and share price changes over time, we can get a feel for how investor attitudes to a company have morphed over time.
Over half a decade, Belvoir Group managed to grow its earnings per share at 28% a year. This EPS growth is higher than the 20% average annual increase in the share price. Therefore, it seems the market has become relatively pessimistic about the company.
The company's earnings per share (over time) is depicted in the image below (click to see the exact numbers).
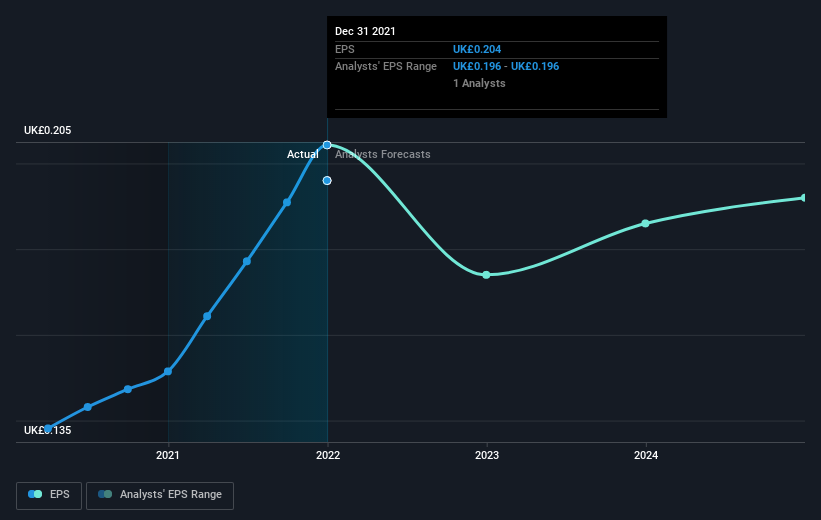
We know that Belvoir Group has improved its bottom line lately, but is it going to grow revenue? You could check out this free report showing analyst revenue forecasts.
What About Dividends?
It is important to consider the total shareholder return, as well as the share price return, for any given stock. Whereas the share price return only reflects the change in the share price, the TSR includes the value of dividends (assuming they were reinvested) and the benefit of any discounted capital raising or spin-off. It's fair to say that the TSR gives a more complete picture for stocks that pay a dividend. In the case of Belvoir Group, it has a TSR of 226% for the last 5 years. That exceeds its share price return that we previously mentioned. The dividends paid by the company have thusly boosted the total shareholder return.
A Different Perspective
We're pleased to report that Belvoir Group shareholders have received a total shareholder return of 12% over one year. And that does include the dividend. Having said that, the five-year TSR of 27% a year, is even better. The pessimistic view would be that be that the stock has its best days behind it, but on the other hand the price might simply be moderating while the business itself continues to execute. I find it very interesting to look at share price over the long term as a proxy for business performance. But to truly gain insight, we need to consider other information, too. Consider for instance, the ever-present spectre of investment risk. We've identified 2 warning signs with Belvoir Group , and understanding them should be part of your investment process.
Of course Belvoir Group may not be the best stock to buy. So you may wish to see this free collection of growth stocks.
Please note, the market returns quoted in this article reflect the market weighted average returns of stocks that currently trade on GB exchanges.
Have feedback on this article? Concerned about the content? Get in touch with us directly. Alternatively, email editorial-team (at) simplywallst.com.
This article by Simply Wall St is general in nature. We provide commentary based on historical data and analyst forecasts only using an unbiased methodology and our articles are not intended to be financial advice. It does not constitute a recommendation to buy or sell any stock, and does not take account of your objectives, or your financial situation. We aim to bring you long-term focused analysis driven by fundamental data. Note that our analysis may not factor in the latest price-sensitive company announcements or qualitative material. Simply Wall St has no position in any stocks mentioned.
