
 Yahoo Finance
 Investing in ATCO (TSE:ACO.X) five years ago would have delivered you a 7.4% gain
Ideally, your overall portfolio should beat the market average. But the main game is to find enough winners to more than offset the losers So we wouldn't blame long term ATCO Ltd. (TSE:ACO.X) shareholders for doubting their decision to hold, with the stock down 11% over a half decade.
Now let's have a look at the company's fundamentals, and see if the long term shareholder return has matched the performance of the underlying business.
Check out our latest analysis for ATCO
To paraphrase Benjamin Graham: Over the short term the market is a voting machine, but over the long term it's a weighing machine. One imperfect but simple way to consider how the market perception of a company has shifted is to compare the change in the earnings per share (EPS) with the share price movement.
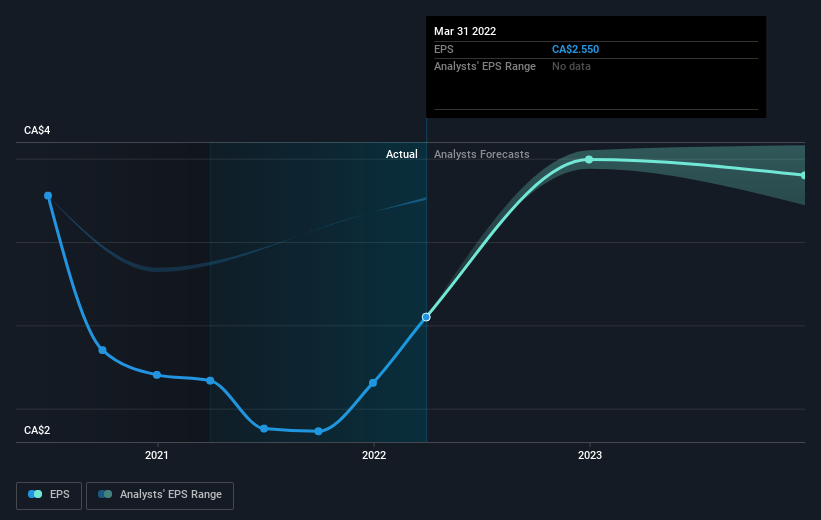
Looking back five years, both ATCO's share price and EPS declined; the latter at a rate of 2.5% per year. This change in EPS is reasonably close to the 2% average annual decrease in the share price. This implies that the market has had a fairly steady view of the stock. Rather, the share price change has reflected changes in earnings per share.
The graphic below depicts how EPS has changed over time (unveil the exact values by clicking on the image).
We like that insiders have been buying shares in the last twelve months. Even so, future earnings will be far more important to whether current shareholders make money. This free interactive report on ATCO's earnings, revenue and cash flow is a great place to start, if you want to investigate the stock further.
What About Dividends?
When looking at investment returns, it is important to consider the difference between total shareholder return (TSR) and share price return. The TSR is a return calculation that accounts for the value of cash dividends (assuming that any dividend received was reinvested) and the calculated value of any discounted capital raisings and spin-offs. It's fair to say that the TSR gives a more complete picture for stocks that pay a dividend. As it happens, ATCO's TSR for the last 5 years was 7.4%, which exceeds the share price return mentioned earlier. This is largely a result of its dividend payments!
A Different Perspective
It's good to see that ATCO has rewarded shareholders with a total shareholder return of 9.5% in the last twelve months. That's including the dividend. That gain is better than the annual TSR over five years, which is 1.4%. Therefore it seems like sentiment around the company has been positive lately. Given the share price momentum remains strong, it might be worth taking a closer look at the stock, lest you miss an opportunity. While it is well worth considering the different impacts that market conditions can have on the share price, there are other factors that are even more important. Even so, be aware that ATCO is showing 2 warning signs in our investment analysis , and 1 of those doesn't sit too well with us...
ATCO is not the only stock insiders are buying. So take a peek at this free list of growing companies with insider buying.
Please note, the market returns quoted in this article reflect the market weighted average returns of stocks that currently trade on CA exchanges.
Have feedback on this article? Concerned about the content? Get in touch with us directly. Alternatively, email editorial-team (at) simplywallst.com.
This article by Simply Wall St is general in nature. We provide commentary based on historical data and analyst forecasts only using an unbiased methodology and our articles are not intended to be financial advice. It does not constitute a recommendation to buy or sell any stock, and does not take account of your objectives, or your financial situation. We aim to bring you long-term focused analysis driven by fundamental data. Note that our analysis may not factor in the latest price-sensitive company announcements or qualitative material. Simply Wall St has no position in any stocks mentioned.
