
 Yahoo Finance
 Investing in Ancom Nylex Berhad (KLSE:ANCOMNY) five years ago would have delivered you a 585% gain
Long term investing can be life changing when you buy and hold the truly great businesses. While not every stock performs well, when investors win, they can win big. For example, the Ancom Nylex Berhad (KLSE:ANCOMNY) share price is up a whopping 544% in the last half decade, a handsome return for long term holders. And this is just one example of the epic gains achieved by some long term investors. We love happy stories like this one. The company should be really proud of that performance!
With that in mind, it's worth seeing if the company's underlying fundamentals have been the driver of long term performance, or if there are some discrepancies.
View our latest analysis for Ancom Nylex Berhad
In his essay The Superinvestors of Graham-and-Doddsville Warren Buffett described how share prices do not always rationally reflect the value of a business. By comparing earnings per share (EPS) and share price changes over time, we can get a feel for how investor attitudes to a company have morphed over time.
During the five years of share price growth, Ancom Nylex Berhad moved from a loss to profitability. Sometimes, the start of profitability is a major inflection point that can signal fast earnings growth to come, which in turn justifies very strong share price gains.
The image below shows how EPS has tracked over time (if you click on the image you can see greater detail).
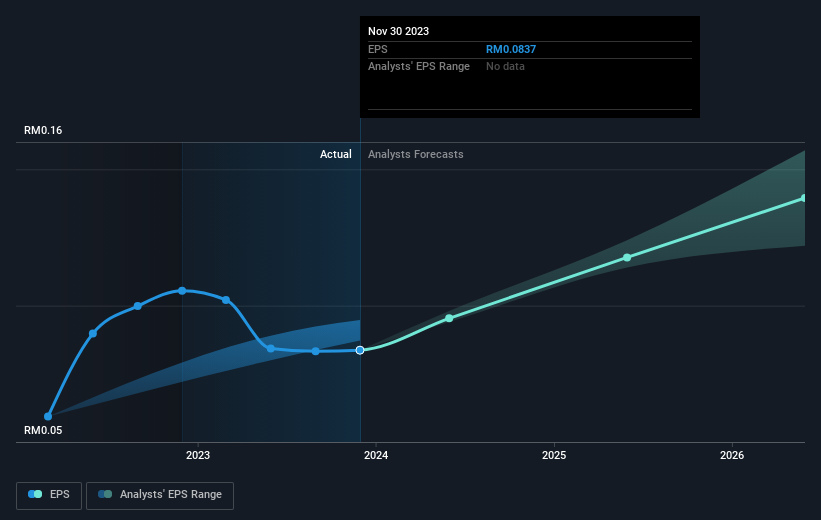
It is of course excellent to see how Ancom Nylex Berhad has grown profits over the years, but the future is more important for shareholders. This free interactive report on Ancom Nylex Berhad's balance sheet strength is a great place to start, if you want to investigate the stock further.
What About Dividends?
When looking at investment returns, it is important to consider the difference between total shareholder return (TSR) and share price return. The TSR is a return calculation that accounts for the value of cash dividends (assuming that any dividend received was reinvested) and the calculated value of any discounted capital raisings and spin-offs. So for companies that pay a generous dividend, the TSR is often a lot higher than the share price return. We note that for Ancom Nylex Berhad the TSR over the last 5 years was 585%, which is better than the share price return mentioned above. And there's no prize for guessing that the dividend payments largely explain the divergence!
A Different Perspective
Ancom Nylex Berhad shareholders are down 6.3% for the year (even including dividends), but the market itself is up 15%. Even the share prices of good stocks drop sometimes, but we want to see improvements in the fundamental metrics of a business, before getting too interested. On the bright side, long term shareholders have made money, with a gain of 47% per year over half a decade. If the fundamental data continues to indicate long term sustainable growth, the current sell-off could be an opportunity worth considering. It's always interesting to track share price performance over the longer term. But to understand Ancom Nylex Berhad better, we need to consider many other factors. For instance, we've identified 1 warning sign for Ancom Nylex Berhad that you should be aware of.
But note: Ancom Nylex Berhad may not be the best stock to buy. So take a peek at this free list of interesting companies with past earnings growth (and further growth forecast).
Please note, the market returns quoted in this article reflect the market weighted average returns of stocks that currently trade on Malaysian exchanges.
Have feedback on this article? Concerned about the content? Get in touch with us directly. Alternatively, email editorial-team (at) simplywallst.com.
This article by Simply Wall St is general in nature. We provide commentary based on historical data and analyst forecasts only using an unbiased methodology and our articles are not intended to be financial advice. It does not constitute a recommendation to buy or sell any stock, and does not take account of your objectives, or your financial situation. We aim to bring you long-term focused analysis driven by fundamental data. Note that our analysis may not factor in the latest price-sensitive company announcements or qualitative material. Simply Wall St has no position in any stocks mentioned.
