
 Yahoo Finance
 Introducing Persimmon (LON:PSN), A Stock That Climbed 90% In The Last Five Years

Stock pickers are generally looking for stocks that will outperform the broader market. And in our experience, buying the right stocks can give your wealth a significant boost. For example, long term Persimmon Plc (LON:PSN) shareholders have enjoyed a 90% share price rise over the last half decade, well in excess of the market return of around 11% (not including dividends). However, more recent returns haven't been as impressive as that, with the stock returning just 42% in the last year , including dividends .
See our latest analysis for Persimmon
To paraphrase Benjamin Graham: Over the short term the market is a voting machine, but over the long term it's a weighing machine. By comparing earnings per share (EPS) and share price changes over time, we can get a feel for how investor attitudes to a company have morphed over time.
During five years of share price growth, Persimmon achieved compound earnings per share (EPS) growth of 21% per year. The EPS growth is more impressive than the yearly share price gain of 14% over the same period. Therefore, it seems the market has become relatively pessimistic about the company. The reasonably low P/E ratio of 10.07 also suggests market apprehension.
The image below shows how EPS has tracked over time (if you click on the image you can see greater detail).
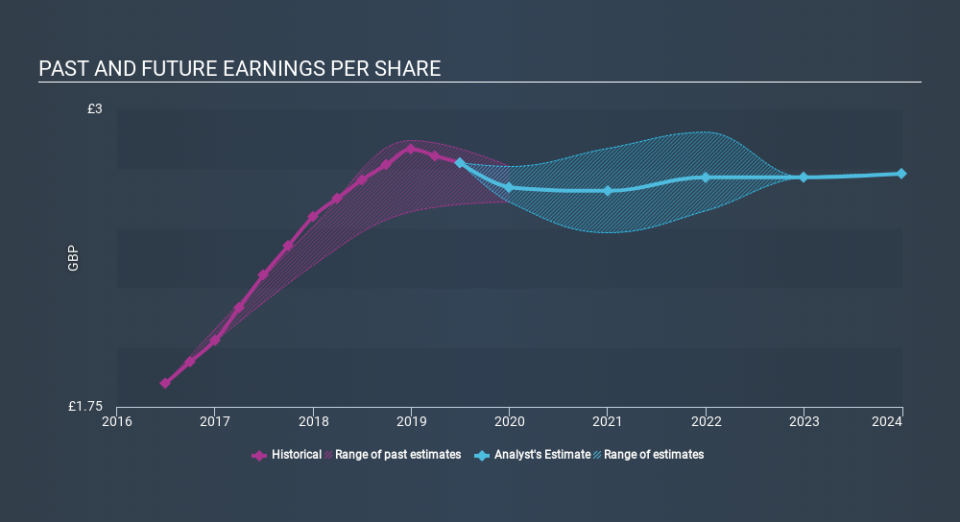
Before buying or selling a stock, we always recommend a close examination of historic growth trends, available here.
What About Dividends?
As well as measuring the share price return, investors should also consider the total shareholder return (TSR). The TSR incorporates the value of any spin-offs or discounted capital raisings, along with any dividends, based on the assumption that the dividends are reinvested. So for companies that pay a generous dividend, the TSR is often a lot higher than the share price return. We note that for Persimmon the TSR over the last 5 years was 174%, which is better than the share price return mentioned above. This is largely a result of its dividend payments!
A Different Perspective
It's good to see that Persimmon has rewarded shareholders with a total shareholder return of 42% in the last twelve months. Of course, that includes the dividend. That gain is better than the annual TSR over five years, which is 22%. Therefore it seems like sentiment around the company has been positive lately. Someone with an optimistic perspective could view the recent improvement in TSR as indicating that the business itself is getting better with time. I find it very interesting to look at share price over the long term as a proxy for business performance. But to truly gain insight, we need to consider other information, too. To that end, you should be aware of the 3 warning signs we've spotted with Persimmon .
We will like Persimmon better if we see some big insider buys. While we wait, check out this free list of growing companies with considerable, recent, insider buying.
Please note, the market returns quoted in this article reflect the market weighted average returns of stocks that currently trade on GB exchanges.
If you spot an error that warrants correction, please contact the editor at editorial-team@simplywallst.com. This article by Simply Wall St is general in nature. It does not constitute a recommendation to buy or sell any stock, and does not take account of your objectives, or your financial situation. Simply Wall St has no position in the stocks mentioned.
We aim to bring you long-term focused research analysis driven by fundamental data. Note that our analysis may not factor in the latest price-sensitive company announcements or qualitative material. Thank you for reading.
