
 Yahoo Finance
 Introducing Diversified Royalty (TSE:DIV), A Stock That Climbed 30% In The Last Three Years

One simple way to benefit from the stock market is to buy an index fund. But if you buy good businesses at attractive prices, your portfolio returns could exceed the average market return. Just take a look at Diversified Royalty Corp. (TSE:DIV), which is up 30%, over three years, soundly beating the market return of 7.0% (not including dividends). On the other hand, the returns haven't been quite so good recently, with shareholders up just 31% , including dividends .
Check out our latest analysis for Diversified Royalty
While markets are a powerful pricing mechanism, share prices reflect investor sentiment, not just underlying business performance. One way to examine how market sentiment has changed over time is to look at the interaction between a company's share price and its earnings per share (EPS).
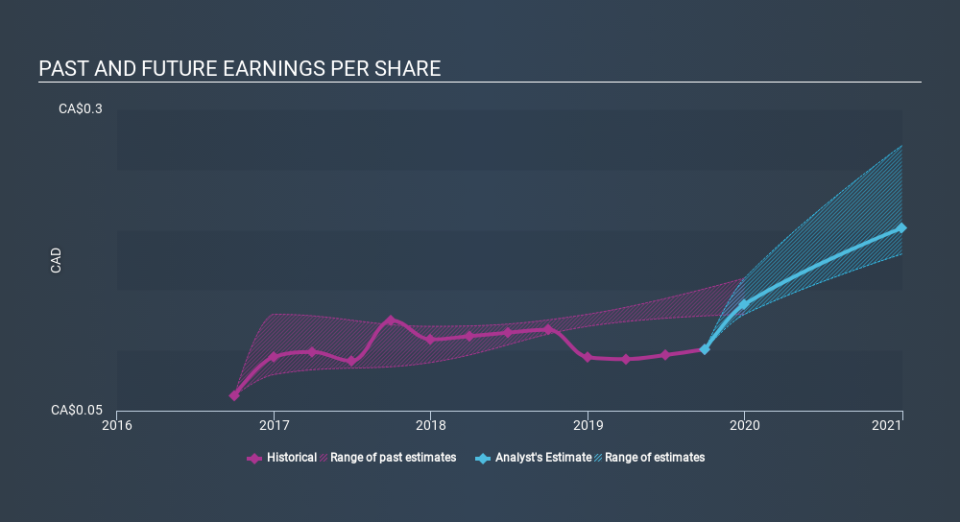
During three years of share price growth, Diversified Royalty achieved compound earnings per share growth of 17% per year. This EPS growth is higher than the 9.1% average annual increase in the share price. So one could reasonably conclude that the market has cooled on the stock.
The image below shows how EPS has tracked over time (if you click on the image you can see greater detail).
We consider it positive that insiders have made significant purchases in the last year. Even so, future earnings will be far more important to whether current shareholders make money. Dive deeper into the earnings by checking this interactive graph of Diversified Royalty's earnings, revenue and cash flow.
What About Dividends?
When looking at investment returns, it is important to consider the difference between total shareholder return (TSR) and share price return. The TSR incorporates the value of any spin-offs or discounted capital raisings, along with any dividends, based on the assumption that the dividends are reinvested. So for companies that pay a generous dividend, the TSR is often a lot higher than the share price return. We note that for Diversified Royalty the TSR over the last 3 years was 63%, which is better than the share price return mentioned above. The dividends paid by the company have thusly boosted the total shareholder return.
A Different Perspective
It's nice to see that Diversified Royalty shareholders have received a total shareholder return of 31% over the last year. Of course, that includes the dividend. That's better than the annualised return of 11% over half a decade, implying that the company is doing better recently. In the best case scenario, this may hint at some real business momentum, implying that now could be a great time to delve deeper. If you want to research this stock further, the data on insider buying is an obvious place to start. You can click here to see who has been buying shares - and the price they paid.
There are plenty of other companies that have insiders buying up shares. You probably do not want to miss this free list of growing companies that insiders are buying.
Please note, the market returns quoted in this article reflect the market weighted average returns of stocks that currently trade on CA exchanges.
If you spot an error that warrants correction, please contact the editor at editorial-team@simplywallst.com. This article by Simply Wall St is general in nature. It does not constitute a recommendation to buy or sell any stock, and does not take account of your objectives, or your financial situation. Simply Wall St has no position in the stocks mentioned.
We aim to bring you long-term focused research analysis driven by fundamental data. Note that our analysis may not factor in the latest price-sensitive company announcements or qualitative material. Thank you for reading.
