
 Yahoo Finance
 An Intrinsic Calculation For Northwest Natural Holding Company (NYSE:NWN) Suggests It's 29% Undervalued
Key Insights
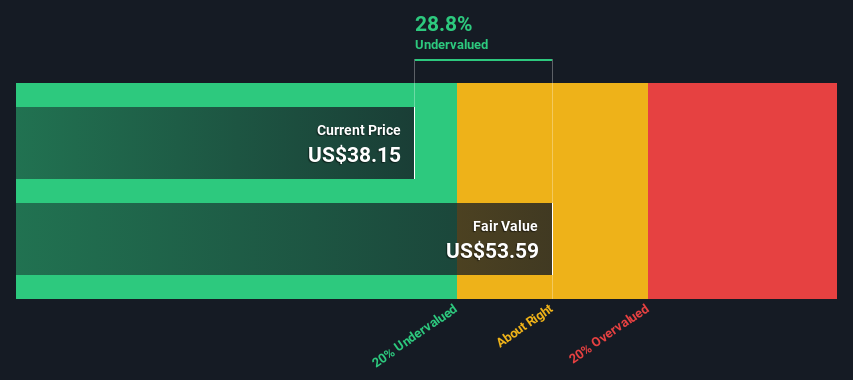
The projected fair value for Northwest Natural Holding is US$53.59 based on Dividend Discount Model
Northwest Natural Holding's US$38.15 share price signals that it might be 29% undervalued
Analyst price target for NWN is US$42.60 which is 21% below our fair value estimate
Does the May share price for Northwest Natural Holding Company (NYSE:NWN) reflect what it's really worth? Today, we will estimate the stock's intrinsic value by estimating the company's future cash flows and discounting them to their present value. Our analysis will employ the Discounted Cash Flow (DCF) model. There's really not all that much to it, even though it might appear quite complex.
Companies can be valued in a lot of ways, so we would point out that a DCF is not perfect for every situation. Anyone interested in learning a bit more about intrinsic value should have a read of the Simply Wall St analysis model.
See our latest analysis for Northwest Natural Holding
Crunching The Numbers
As Northwest Natural Holding operates in the gas utilities sector, we need to calculate the intrinsic value slightly differently. In this approach dividends per share (DPS) are used, as free cash flow is difficult to estimate and often not reported by analysts. Unless a company pays out the majority of its FCF as a dividend, this method will typically underestimate the value of the stock. The 'Gordon Growth Model' is used, which simply assumes that dividend payments will continue to increase at a sustainable growth rate forever. The dividend is expected to grow at an annual growth rate equal to the 5-year average of the 10-year government bond yield of 2.3%. We then discount this figure to today's value at a cost of equity of 6.0%. Relative to the current share price of US$38.2, the company appears a touch undervalued at a 29% discount to where the stock price trades currently. The assumptions in any calculation have a big impact on the valuation, so it is better to view this as a rough estimate, not precise down to the last cent.
Value Per Share = Expected Dividend Per Share / (Discount Rate - Perpetual Growth Rate)
= US$2.0 / (6.0% – 2.3%)
= US$53.6
The Assumptions
The calculation above is very dependent on two assumptions. The first is the discount rate and the other is the cash flows. Part of investing is coming up with your own evaluation of a company's future performance, so try the calculation yourself and check your own assumptions. The DCF also does not consider the possible cyclicality of an industry, or a company's future capital requirements, so it does not give a full picture of a company's potential performance. Given that we are looking at Northwest Natural Holding as potential shareholders, the cost of equity is used as the discount rate, rather than the cost of capital (or weighted average cost of capital, WACC) which accounts for debt. In this calculation we've used 6.0%, which is based on a levered beta of 0.800. Beta is a measure of a stock's volatility, compared to the market as a whole. We get our beta from the industry average beta of globally comparable companies, with an imposed limit between 0.8 and 2.0, which is a reasonable range for a stable business.
SWOT Analysis for Northwest Natural Holding
Strength
Earnings growth over the past year exceeded the industry.
Dividend is in the top 25% of dividend payers in the market.
Weakness
Interest payments on debt are not well covered.
Shareholders have been diluted in the past year.
Opportunity
Annual earnings are forecast to grow for the next 3 years.
Good value based on P/E ratio and estimated fair value.
Threat
Debt is not well covered by operating cash flow.
Paying a dividend but company has no free cash flows.
Annual earnings are forecast to grow slower than the American market.
Looking Ahead:
Whilst important, the DCF calculation ideally won't be the sole piece of analysis you scrutinize for a company. It's not possible to obtain a foolproof valuation with a DCF model. Rather it should be seen as a guide to "what assumptions need to be true for this stock to be under/overvalued?" For instance, if the terminal value growth rate is adjusted slightly, it can dramatically alter the overall result. Why is the intrinsic value higher than the current share price? For Northwest Natural Holding, we've compiled three relevant elements you should further examine:
Risks: We feel that you should assess the 3 warning signs for Northwest Natural Holding (1 is significant!) we've flagged before making an investment in the company.
Future Earnings: How does NWN's growth rate compare to its peers and the wider market? Dig deeper into the analyst consensus number for the upcoming years by interacting with our free analyst growth expectation chart.
Other High Quality Alternatives: Do you like a good all-rounder? Explore our interactive list of high quality stocks to get an idea of what else is out there you may be missing!
PS. Simply Wall St updates its DCF calculation for every American stock every day, so if you want to find the intrinsic value of any other stock just search here.
Have feedback on this article? Concerned about the content? Get in touch with us directly. Alternatively, email editorial-team (at) simplywallst.com.
This article by Simply Wall St is general in nature. We provide commentary based on historical data and analyst forecasts only using an unbiased methodology and our articles are not intended to be financial advice. It does not constitute a recommendation to buy or sell any stock, and does not take account of your objectives, or your financial situation. We aim to bring you long-term focused analysis driven by fundamental data. Note that our analysis may not factor in the latest price-sensitive company announcements or qualitative material. Simply Wall St has no position in any stocks mentioned.
