
 Yahoo Finance
 Interested In Snam Sp.A. (BIT:SRG)? Here’s What Its Recent Performance Looks Like

Assessing Snam Sp.A.’s (BIT:SRG) past track record of performance is an insightful exercise for investors. It allows us to reflect on whether or not the company has met or exceed expectations, which is a great indicator for future performance. Today I will assess SRG’s recent performance announced on 31 March 2018 and evaluate these figures to its long-term trend and industry movements. See our latest analysis for Snam
How Did SRG’s Recent Performance Stack Up Against Its Past?
To account for any quarterly or half-yearly updates, I use the ‘latest twelve-month’ data, which annualizes the most recent half-year data, or in some cases, the latest annual report is already the most recent financial year data. This blend allows me to analyze different stocks on a more comparable basis, using new information. For Snam, its most recent trailing-twelve-month earnings is €897.00M, which, against last year’s figure, has risen by 34.89%. Given that these values are fairly short-term thinking, I’ve estimated an annualized five-year value for SRG’s net income, which stands at €864.32M This shows that, generally, Snam has been able to consistently raise its net income over the past few years as well.
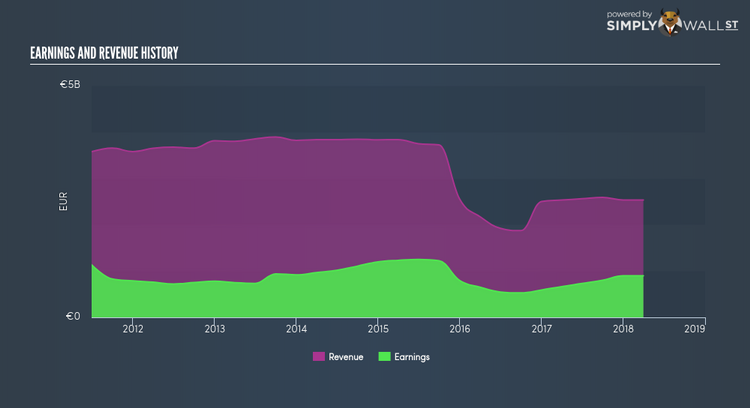
What’s the driver of this growth? Well, let’s take a look at whether it is only due to industry tailwinds, or if Snam has seen some company-specific growth. In the past couple of years, though bottom-line growth has seen a weakening, top-line growth has dropped much faster, causing a margin expansion and Snam still maintaining profitability. Looking at growth from a sector-level, the IT oil and gas industry has been growing its average earnings by double-digit 24.02% over the prior year, and a flatter -1.67% over the past five. This means that, in the recent industry expansion, Snam is able to amplify this to its advantage.
What does this mean?
Snam’s track record can be a valuable insight into its earnings performance, but it certainly doesn’t tell the whole story. Positive growth and profitability are what investors like to see in a company’s track record, but how do we properly assess sustainability? You should continue to research Snam to get a better picture of the stock by looking at:
Future Outlook: What are well-informed industry analysts predicting for SRG’s future growth? Take a look at our free research report of analyst consensus for SRG’s outlook.
Financial Health: Is SRG’s operations financially sustainable? Balance sheets can be hard to analyze, which is why we’ve done it for you. Check out our financial health checks here.
Other High-Performing Stocks: Are there other stocks that provide better prospects with proven track records? Explore our free list of these great stocks here.
NB: Figures in this article are calculated using data from the trailing twelve months from 31 March 2018. This may not be consistent with full year annual report figures.
To help readers see pass the short term volatility of the financial market, we aim to bring you a long-term focused research analysis purely driven by fundamental data. Note that our analysis does not factor in the latest price sensitive company announcements.
The author is an independent contributor and at the time of publication had no position in the stocks mentioned.
