
 Yahoo Finance
 Interested In Salvatore Ferragamo SpA (BIT:SFER)? Here’s How It Performed Recently

Measuring Salvatore Ferragamo SpA’s (BIT:SFER) track record of past performance is a useful exercise for investors. It enables us to understand whether or not the company has met or exceed expectations, which is an insightful signal for future performance. Today I will assess SFER’s recent performance announced on 31 March 2018 and weigh these figures against its long-term trend and industry movements. View out our latest analysis for Salvatore Ferragamo
Was SFER weak performance lately part of a long-term decline?
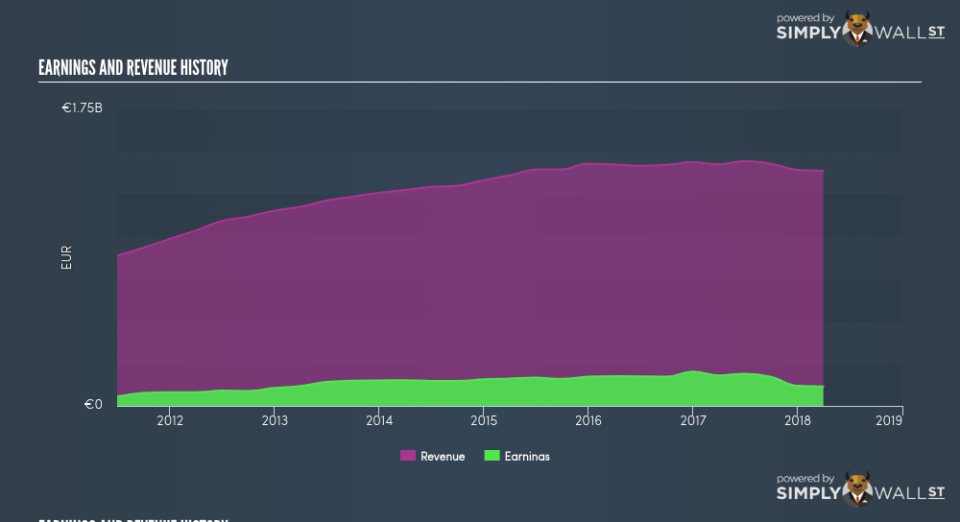
SFER’s trailing twelve-month earnings (from 31 March 2018) of €115.36m has declined by -35.93% compared to the previous year. Furthermore, this one-year growth rate has been lower than its average earnings growth rate over the past 5 years of 10.39%, indicating the rate at which SFER is growing has slowed down. Why could this be happening? Let’s examine what’s going on with margins and if the entire industry is facing the same headwind.
Over the last couple of years, revenue growth has not been able to catch up, which indicates that Salvatore Ferragamo’s bottom line has been driven by unsustainable cost-cutting. Viewing growth from a sector-level, the IT luxury industry has been growing its average earnings by double-digit 32.77% in the past year, and a more subdued 6.08% over the past five. This means any tailwind the industry is deriving benefit from, Salvatore Ferragamo has not been able to leverage it as much as its average peer.
In terms of returns from investment, Salvatore Ferragamo has not invested its equity funds well, leading to a 14.61% return on equity (ROE), below the sensible minimum of 20%. However, its return on assets (ROA) of 10.08% exceeds the IT Luxury industry of 7.57%, indicating Salvatore Ferragamo has used its assets more efficiently. Though, its return on capital (ROC), which also accounts for Salvatore Ferragamo’s debt level, has declined over the past 3 years from 39.13% to 20.02%.
What does this mean?
Though Salvatore Ferragamo’s past data is helpful, it is only one aspect of my investment thesis. Typically companies that experience a drawn out period of reduction in earnings are undergoing some sort of reinvestment phase with the aim of keeping up with the recent industry disruption and growth. I recommend you continue to research Salvatore Ferragamo to get a more holistic view of the stock by looking at:
Future Outlook: What are well-informed industry analysts predicting for SFER’s future growth? Take a look at our free research report of analyst consensus for SFER’s outlook.
Financial Health: Is SFER’s operations financially sustainable? Balance sheets can be hard to analyze, which is why we’ve done it for you. Check out our financial health checks here.
Other High-Performing Stocks: Are there other stocks that provide better prospects with proven track records? Explore our free list of these great stocks here.
NB: Figures in this article are calculated using data from the trailing twelve months from 31 March 2018. This may not be consistent with full year annual report figures.
To help readers see pass the short term volatility of the financial market, we aim to bring you a long-term focused research analysis purely driven by fundamental data. Note that our analysis does not factor in the latest price sensitive company announcements.
The author is an independent contributor and at the time of publication had no position in the stocks mentioned.
