
 Yahoo Finance
 Intercontinental (ICE) Q2 Earnings Top Estimates, Revenues Lag

Intercontinental Exchange ICE reported second-quarter 2023 adjusted earnings per share of $1.43, which beat the Zacks Consensus Estimate by 4.4%. The bottom line increased 8.3% on a year-over-year basis.
Intercontinental Exchange witnessed a year-over-year revenue increase, attributable to solid results at the Mortgage Technology segment. Lower expenses were also a respite.
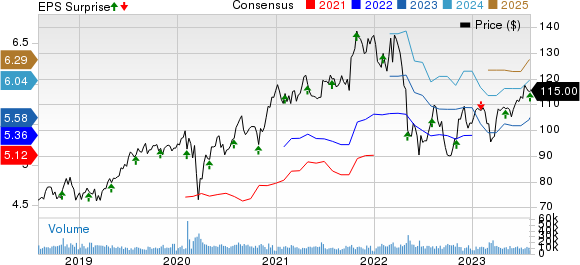
Intercontinental Exchange Inc. Price, Consensus and EPS Surprise
Intercontinental Exchange Inc. price-consensus-eps-surprise-chart | Intercontinental Exchange Inc. Quote
Performance in Detail
Intercontinental Exchange’s revenues, less transaction-based expenses, of $1.9 billion increased 4.1% year over year as a result of higher revenues at the Exchanges and Fixed Income and Data Services segment. The top line missed the Zacks Consensus Estimate by 0.2%.
Total operating expenses decreased 1.3% year over year to $933 million, primarily due to lower compensation and benefits, acquisition-related transaction and integration costs and professional services. Our estimate was $912.1 million. Adjusted operating expenses were $756 million in the quarter, up 2.2% from the year-ago figure but lower than our estimate of $763.3 million.
Adjusted operating income increased 5.4% year over year to $1.1 billion, in line with our estimate. Adjusted operating margin expanded 100 basis points year over year to 60%.
Segment Details
Exchanges' net revenues were $1.1 billion, up 9% year over year. However, revenues were lower than our estimate of $1.6 billion.
Adjusted operating income of $800 million was up 11.4% year over year. The Zacks Consensus Estimate was pegged at $748 million. Our estimate was $738.9 million. Adjusted operating margin expanded 200 basis points year over year to 73%. Our estimate was 70.9%.
Fixed Income and Data Services' revenues were $546 million, which increased 7% year over year and came in higher than our estimate of $544.5 million. The Zacks Consensus Estimate was pegged at $551 million.
Adjusted operating income rose 6.9% to $233 million. The Zacks Consensus Estimate was pegged at $253 million. Our estimate was $243.6 million.
Adjusted operating margin remained flat year over year at 43%. Our estimate was 44.7%.
Mortgage Technology’s revenues decreased 16% to $249 million and were lower than our estimate of $257 million. The Zacks Consensus Estimate was pegged at $258 million.
Adjusted operating income of $99 million was down 28.3% year over year. The Zacks Consensus Estimate was pegged at $96 million. Our estimate was $97.5 million.
Adjusted operating margin contracted 600 bps to 40%. Our estimate was 38%.
Financial Update
As of Jun 30, 2023, Intercontinental Exchange had cash and cash equivalents of $8.3 billion, up 4.3% from the Dec 31, 2022 level. Long-term debt of $18.1 billion increased 0.1% from the 2022-end level.
Total equity was $22.8 billion as of Jun 30, 2023, up 5% from 2022-end.
Operating cash flow was $1.8 million, up 4.6% year over year. Adjusted free cash flow was $1.7 million, up 17.5% year over year.
Intercontinental Exchange paid out $472 million in dividends in the first half of 2023.
Q3 Guidance
GAAP operating expenses are expected to be in the range of $910 million to $920 million. Adjusted operating expenses are expected to be in the range of $760 million to $770 million.
GAAP non-operating expense is expected to be in the range of $80 million to $85 million. Adjusted non-operating expense is expected to be in the range of $70 million to $75 million.
Share count is expected to be in the range of 560 million to 564 million.
2023 Guidance
Mortgage Technology recurring revenue growth is now expected to be in low-single digits.
GAAP operating expenses are expected to be in the range of $3.675 billion to $3.725 billion. Adjusted operating expenses are now expected to be in the range of $3.04 billion to $3.06 billion.
Dividend Update
The board of directors approved a dividend of 42 cents per share for the third quarter of 2023. The dividend will be paid out on Sep 29 to shareholders of record as of Sep 15.
Zacks Rank
Intercontinental Exchange currently carries a Zacks Rank #2 (Buy). You can see the complete list of today’s Zacks #1 Rank (Strong Buy) stocks here.
Performance of Other Securities and Exchanges
Nasdaq NDAQ reported second-quarter 2023 adjusted earnings per share of 71 cents, beating the Zacks Consensus Estimate of 65 cents. The bottom line improved 3% year over year. The improvement was mainly driven by organic growth and solid results at the Solutions segment. Nasdaq’s revenues of $925 million increased 4% year over year. The upside can primarily be attributed to a 4% impact from organic growth, including contributions from all segments. The top line beat the Zacks Consensus Estimate of $910 million.
Annualized Recurring Revenue (ARR) increased 6% year over year. Annualized SaaS revenues increased 11% and represented 36% of ARR. Operating margin of 52% contracted 200 basis points year over year.
Nasdaq expects 2023 non-GAAP operating expenses in the range of $1.785 billion to $1.815 billion, compared with the prior expectation of $1.78 billion to $1.84 billion.
MarketAxess Holdings Inc. MKTX reported second-quarter 2023 earnings per share of $1.63, which outpaced the Zacks Consensus Estimate of $1.58. The bottom line, however, declined from $1.78 per share a year ago.
Total revenues decreased 1.3% year over year to $179.8 million in the quarter under review. The top line also missed the consensus mark by 0.8%.
MarketAxess reported an operating income of $75.7 million, which decreased 10.7% year over year in the second quarter and missed our estimate by 8.5%.
MarketAxess’ high-grade trading volume declined 1.8% year over year to $353.2 billion, missing our estimate by 5.1%. ADV of the same product category fell 1.8% year over year to $5,697 million, missing our estimate by 5.1%.
CME Group CME reported second-quarter 2023 record adjusted earnings per share of $2.30, which beat the Zacks Consensus Estimate by 5.5%. The bottom line increased 16.8% year over year. CME Group’s revenues of $1.4 billion increased 9.9% year over year. The year-over-year increase was primarily due to higher clearing and transaction fees (up 9.1% year over year) and market data and information services (up 7.5% year over year). The top line beat the Zacks Consensus Estimate by 1.3%.
Operating income increased 11.9% from the prior-year quarter to $838.6 million and beat our estimate of $831.9 million.
Average daily volume (ADV) was 22.9 million contracts. Non-U.S. ADV reached 6.3 million contracts, which included double-digit year-over-year growth in Agricultural, Metals and Energy products.
Want the latest recommendations from Zacks Investment Research? Today, you can download 7 Best Stocks for the Next 30 Days. Click to get this free report
Intercontinental Exchange Inc. (ICE) : Free Stock Analysis Report
CME Group Inc. (CME) : Free Stock Analysis Report
Nasdaq, Inc. (NDAQ) : Free Stock Analysis Report
MarketAxess Holdings Inc. (MKTX) : Free Stock Analysis Report
