
 Yahoo Finance
 Intercontinental Exchange (NYSE:ICE) shareholders have earned a 11% CAGR over the last five years
If you buy and hold a stock for many years, you'd hope to be making a profit. Better yet, you'd like to see the share price move up more than the market average. Unfortunately for shareholders, while the Intercontinental Exchange, Inc. (NYSE:ICE) share price is up 55% in the last five years, that's less than the market return. Zooming in, the stock is up a respectable 9.2% in the last year.
So let's investigate and see if the longer term performance of the company has been in line with the underlying business' progress.
View our latest analysis for Intercontinental Exchange
While the efficient markets hypothesis continues to be taught by some, it has been proven that markets are over-reactive dynamic systems, and investors are not always rational. One imperfect but simple way to consider how the market perception of a company has shifted is to compare the change in the earnings per share (EPS) with the share price movement.
Intercontinental Exchange's earnings per share are down 1.3% per year, despite strong share price performance over five years.
So it's hard to argue that the earnings per share are the best metric to judge the company, as it may not be optimized for profits at this point. Since the change in EPS doesn't seem to correlate with the change in share price, it's worth taking a look at other metrics.
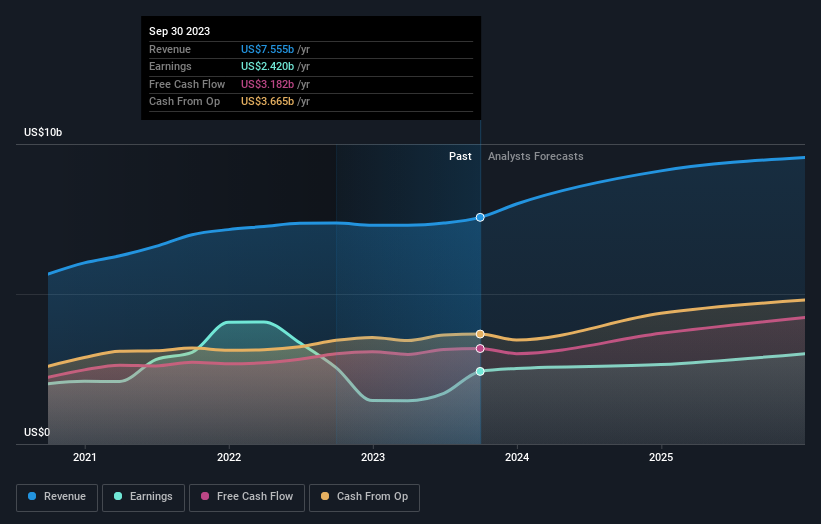
The modest 1.4% dividend yield is unlikely to be propping up the share price. On the other hand, Intercontinental Exchange's revenue is growing nicely, at a compound rate of 10% over the last five years. It's quite possible that management are prioritizing revenue growth over EPS growth at the moment.
The image below shows how earnings and revenue have tracked over time (if you click on the image you can see greater detail).
Intercontinental Exchange is well known by investors, and plenty of clever analysts have tried to predict the future profit levels. You can see what analysts are predicting for Intercontinental Exchange in this interactive graph of future profit estimates.
What About Dividends?
As well as measuring the share price return, investors should also consider the total shareholder return (TSR). The TSR is a return calculation that accounts for the value of cash dividends (assuming that any dividend received was reinvested) and the calculated value of any discounted capital raisings and spin-offs. So for companies that pay a generous dividend, the TSR is often a lot higher than the share price return. As it happens, Intercontinental Exchange's TSR for the last 5 years was 65%, which exceeds the share price return mentioned earlier. And there's no prize for guessing that the dividend payments largely explain the divergence!
A Different Perspective
Intercontinental Exchange shareholders are up 11% for the year (even including dividends). But that was short of the market average. The silver lining is that the gain was actually better than the average annual return of 11% per year over five year. It is possible that returns will improve along with the business fundamentals. While it is well worth considering the different impacts that market conditions can have on the share price, there are other factors that are even more important. For instance, we've identified 2 warning signs for Intercontinental Exchange (1 is a bit concerning) that you should be aware of.
But note: Intercontinental Exchange may not be the best stock to buy. So take a peek at this free list of interesting companies with past earnings growth (and further growth forecast).
Please note, the market returns quoted in this article reflect the market weighted average returns of stocks that currently trade on American exchanges.
Have feedback on this article? Concerned about the content? Get in touch with us directly. Alternatively, email editorial-team (at) simplywallst.com.
This article by Simply Wall St is general in nature. We provide commentary based on historical data and analyst forecasts only using an unbiased methodology and our articles are not intended to be financial advice. It does not constitute a recommendation to buy or sell any stock, and does not take account of your objectives, or your financial situation. We aim to bring you long-term focused analysis driven by fundamental data. Note that our analysis may not factor in the latest price-sensitive company announcements or qualitative material. Simply Wall St has no position in any stocks mentioned.
