
 Yahoo Finance
 Innovid Corp.'s (NYSE:CTV) largest shareholders are individual investors with 39% ownership, institutions own 23%
Key Insights
Innovid's significant individual investors ownership suggests that the key decisions are influenced by shareholders from the larger public
The top 17 shareholders own 50% of the company
A look at the shareholders of Innovid Corp. (NYSE:CTV) can tell us which group is most powerful. With 39% stake, individual investors possess the maximum shares in the company. In other words, the group stands to gain the most (or lose the most) from their investment into the company.
And institutions on the other hand have a 23% ownership in the company. Institutions often own shares in more established companies, while it's not unusual to see insiders own a fair bit of smaller companies.
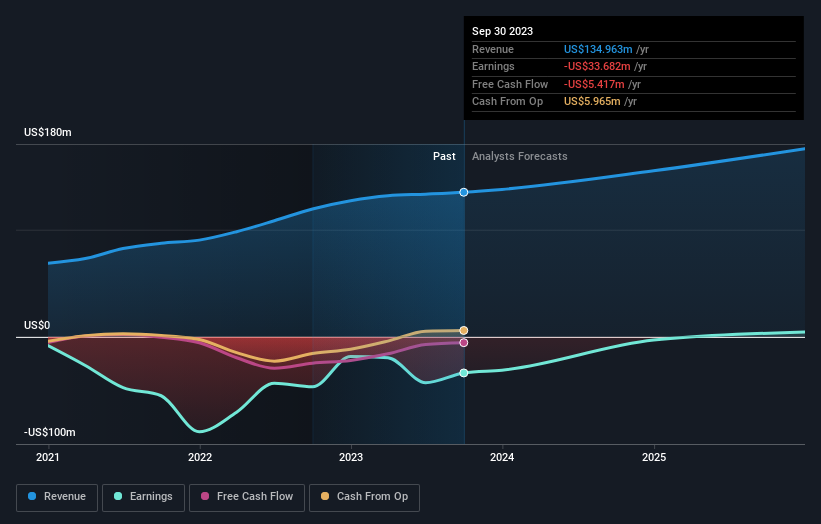
Let's delve deeper into each type of owner of Innovid, beginning with the chart below.
View our latest analysis for Innovid

What Does The Institutional Ownership Tell Us About Innovid?
Institutions typically measure themselves against a benchmark when reporting to their own investors, so they often become more enthusiastic about a stock once it's included in a major index. We would expect most companies to have some institutions on the register, especially if they are growing.
We can see that Innovid does have institutional investors; and they hold a good portion of the company's stock. This can indicate that the company has a certain degree of credibility in the investment community. However, it is best to be wary of relying on the supposed validation that comes with institutional investors. They too, get it wrong sometimes. It is not uncommon to see a big share price drop if two large institutional investors try to sell out of a stock at the same time. So it is worth checking the past earnings trajectory of Innovid, (below). Of course, keep in mind that there are other factors to consider, too.
Our data indicates that hedge funds own 5.0% of Innovid. That's interesting, because hedge funds can be quite active and activist. Many look for medium term catalysts that will drive the share price higher. The company's largest shareholder is Sequoia Capital Israel Ltd., with ownership of 13%. The second and third largest shareholders are Vintage Ventures Advisors Ltd. and Ion Asset Management, with an equal amount of shares to their name at 5.0%. In addition, we found that Zvika Netter, the CEO has 4.0% of the shares allocated to their name.
A closer look at our ownership figures suggests that the top 17 shareholders have a combined ownership of 50% implying that no single shareholder has a majority.
While it makes sense to study institutional ownership data for a company, it also makes sense to study analyst sentiments to know which way the wind is blowing. There are plenty of analysts covering the stock, so it might be worth seeing what they are forecasting, too.
Insider Ownership Of Innovid
While the precise definition of an insider can be subjective, almost everyone considers board members to be insiders. The company management answer to the board and the latter should represent the interests of shareholders. Notably, sometimes top-level managers are on the board themselves.
I generally consider insider ownership to be a good thing. However, on some occasions it makes it more difficult for other shareholders to hold the board accountable for decisions.
We can report that insiders do own shares in Innovid Corp.. It has a market capitalization of just US$225m, and insiders have US$22m worth of shares, in their own names. Some would say this shows alignment of interests between shareholders and the board. But it might be worth checking if those insiders have been selling.
General Public Ownership
The general public-- including retail investors -- own 39% stake in the company, and hence can't easily be ignored. While this group can't necessarily call the shots, it can certainly have a real influence on how the company is run.
Private Equity Ownership
With a stake of 18%, private equity firms could influence the Innovid board. Some might like this, because private equity are sometimes activists who hold management accountable. But other times, private equity is selling out, having taking the company public.
Private Company Ownership
We can see that Private Companies own 5.2%, of the shares on issue. Private companies may be related parties. Sometimes insiders have an interest in a public company through a holding in a private company, rather than in their own capacity as an individual. While it's hard to draw any broad stroke conclusions, it is worth noting as an area for further research.
Next Steps:
I find it very interesting to look at who exactly owns a company. But to truly gain insight, we need to consider other information, too. Consider for instance, the ever-present spectre of investment risk. We've identified 2 warning signs with Innovid , and understanding them should be part of your investment process.
Ultimately the future is most important. You can access this free report on analyst forecasts for the company.
NB: Figures in this article are calculated using data from the last twelve months, which refer to the 12-month period ending on the last date of the month the financial statement is dated. This may not be consistent with full year annual report figures.
Have feedback on this article? Concerned about the content? Get in touch with us directly. Alternatively, email editorial-team (at) simplywallst.com.
This article by Simply Wall St is general in nature. We provide commentary based on historical data and analyst forecasts only using an unbiased methodology and our articles are not intended to be financial advice. It does not constitute a recommendation to buy or sell any stock, and does not take account of your objectives, or your financial situation. We aim to bring you long-term focused analysis driven by fundamental data. Note that our analysis may not factor in the latest price-sensitive company announcements or qualitative material. Simply Wall St has no position in any stocks mentioned.
